Archaeologists Discover Oldest Direct Evidence for Honey Collecting in Africa in Ancient Clay Pots

Traces of beeswax were detected in 3500 year-old clay pots like this. Credit: Peter Breunig, Goethe University Frankfurt

Scientists at Goethe University and University of Bristol (UK) find traces of beeswax in prehistoric pottery of the West African Nok culture.

Before sugar cane and sugar beets conquered the world, honey was the worldwide most important natural product for sweetening. Archaeologists at Goethe University in cooperation with chemists at the University of Bristol have now produced the oldest direct evidence of honey collecting of in Africa. They used chemical food residues in potsherds found in Nigeria.

Honey is humankind’s oldest sweetener – and for thousands of years it was also the only one. Indirect clues about the significance of bees and bee products are provided by prehistoric petroglyphs on various continents, created between 8,000 and 40,000 years ago. Ancient Egyptian reliefs indicate the practice of beekeeping as early as 2600 year BCE. But for sub-Saharan Africa, direct archaeological evidence has been lacking until now. The analysis of the chemical residues of food in potsherds has fundamentally altered the picture. Archaeologists at Goethe University in cooperation with chemists at the University of Bristol were able to identify beeswax residues in 3500 year-old potsherds of the Nok culture.

The Nok culture in central Nigeria dates between 1500 BCE and the beginning of the Common Era and is known particularly for its elaborate terracotta sculptures. These sculptures represent the oldest figurative art in Africa. Until a few years ago, the social context in which these sculptures had been created was completely unknown. In a project funded by the German Research Foundation, Goethe University scientists have been studying the Nok culture in all its archaeological facets for over twelve years. In addition to settlement pattern, chronology, and meaning of the terracotta sculptures, the research also focussed on environment, subsistence and diet.

Did the people of the Nok Culture have domesticated animals or were they hunters? Archaeologists typically use animal bones from excavations to answer these questions. But what to do if the soil is so acidic that bones are not preserved, as is the case in the Nok region?

The analysis of molecular food residues in pottery opens up new possibilities. This is because the processing of plant and animal products in clay pots releases stable chemical compounds, especially fatty acids (lipids). These can be preserved in the pores of the vessel walls for thousands of years, and can be detected with the assistance of gas chromatography.

To the researchers’ great surprise, they found numerous other components besides the remains of wild animals, significantly expanding the previously known spectrum of animals and plants used. There is one creature in particular that they had not expected: the honeybee. A third of the examined shards contained high-molecular lipids, typical for beeswax.

It is not possible to reconstruct from the lipids which bee products were used by the people of the Nok culture. Most probably they separated the honey from the waxy combs by heating them in the pots. But it is also conceivable that honey was processed together with other raw materials from animals or plants, or that they made mead. The wax itself could have served technical or medical purposes. Another possibility is the use of clay pots as beehives, as is practiced to this day in traditional African societies.

“We began this study with our colleagues in Bristol because we wanted to know if the Nok people had domesticated animals,” explains Professor Peter Breunig from Goethe University, who is the director of the archaeological Nok project. “That honey was part of their daily menu was completely unexpected, and unique in the early history of Africa until now.”

Dr. Julie Dunne from the University of Bristol, first author of the study says: “This is a remarkable example of how biomolecular information from prehistoric pottery in combination with ethnographic data provides insight into the use of honey 3500 years ago.”

Professor Richard Evershed, Head of the Institute for Organic Chemistry at the University of Bristol and co-author of the study points out that the special relationship between humans and honeybees was already known in antiquity. “But the discovery of beeswax residues in Nok pottery allows a very unique insight into this relationship, when all other sources of evidence are lacking.”

Professor Katharina Neumann, who is in charge of archaeobotany in the Nok project at Goethe University says: “Plant and animal residues from archaeological excavations reflect only a small section of what prehistoric people ate. The chemical residues make previously invisible components of the prehistoric diet visible.” The first direct evidence of beeswax opens up fascinating perspectives for the archaeology of Africa. Neumann: “We assume that the use of honey in Africa has a very long tradition. The oldest pottery on the continent is about 11,000 years old. Does it perhaps also contain beeswax residues? Archives around the world store thousands of ceramic shards from archaeological excavations that are just waiting to reveal their secrets through gas chromatography and paint a picture of the daily life and diet of prehistoric people.”

For more on this research, read Ancient Pottery Reveals First Evidence of Prehistoric Honey Hunting in West Africa 3,500 Years Ago.

Reference: “Honey-collecting in prehistoric West Africa from 3,500 years ago” by Julie Dunne, Alexa Höhn, Gabriele Franke, Katharina Neumann, Peter Breunig, Toby Gillard, Caitlin Walton-Doyle and Richard P. Evershed, 14 April 2021, Nature Communications.
DOI: 10.1038/s41467-021-22425-4

Of Mice and Spacemen: Understanding Astronaut Muscle Wasting at the Molecular Level

Researchers from the University of Tsukuba have sent mice into space to explore effects of spaceflight and reduced gravity on muscle atrophy, or wasting at the molecular level.

Most of us have imagined how free it would feel to float around, like an astronaut, in conditions of reduced gravity. But have you ever considered what the effects of reduced gravity might have on muscles? Gravity is a constant force on Earth which all living creatures have evolved to rely on and adapt to. Space exploration has brought about many scientific and technological advances, yet manned spaceflights come at a cost to astronauts, including reduced skeletal muscle mass and strength.

Conventional studies investigating the effects of reduced gravity on muscle mass and function have used a ground control group that is not directly comparable to the space experimental group. Researchers from the University of Tsukuba set out to explore the effects of gravity in mice subjected to the same housing conditions, including those experienced during launch and landing. “In humans, spaceflight causes muscle atrophy and can lead to serious medical problems after return to Earth,” says senior author Professor Satoru Takahashi. “This study was designed based on the critical need to understand the molecular mechanisms through which muscle atrophy occurs in conditions of microgravity and artificial gravity.”

Two groups of mice (six per group) were housed onboard the International Space Station for 35 days. One group was subjected to artificial gravity (1 g) and the other to microgravity. All mice were alive upon return to Earth and the team compared the effects of the different onboard environments on skeletal muscles.

“To understand what was happening inside the muscles and cells, at the molecular level, we examined the muscle fibers. Our results show that artificial gravity prevents the changes observed in mice subjected to microgravity, including muscle atrophy and changes in gene expression,” explained Prof. Takahashi. Transcriptional analysis of gene expression revealed that artificial gravity prevented altered expression of atrophy related genes and identified novel candidate genes associated with atrophy. Specifically, a gene called Cacng1 was identified as possibly having a functional role in myotube atrophy.

This work supports the use of spaceflight datasets using 1 g artificial gravity for examining the effects of spaceflight in muscles. These studies will likely aid our understanding of the mechanisms of muscle atrophy and may ultimately influence the treatment of related diseases.

Reference: “Transcriptome analysis of gravitational effects on mouse skeletal muscles under microgravity and artificial 1 g onboard environment” by Risa Okada, Shin-ichiro Fujita, Riku Suzuki, Takuto Hayashi, Hirona Tsubouchi, Chihiro Kato, Shunya Sadaki, Maho Kanai, Sayaka Fuseya, Yuri Inoue, Hyojung Jeon, Michito Hamada, Akihiro Kuno, Akiko Ishii, Akira Tamaoka, Jun Tanihata, Naoki Ito, Dai Shiba, Masaki Shirakawa, Masafumi Muratani, Takashi Kudo and Satoru Takahashi, 28 April 2021, Scientific Reports.
DOI: 10.1038/s41598-021-88392-4

Critically Endangered Iconic Great Apes in Borneo Lost Muscle During Fruit Shortages
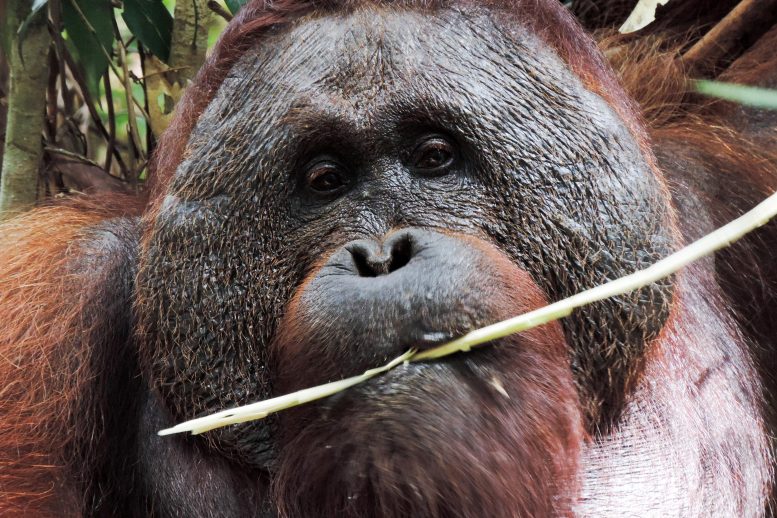
Orangutan on Borneo

A male orangutan eating non-fruit vegetation instead of the fruit orangutans prefer on the island of Borneo in Southeast Asia. Credit: Kristana Parinters Makur/Tuanan Orangutan Research Project

Highlights Need to Protect Orangutan Habitat

Wild orangutans are known for their ability to survive food shortages, but scientists have made a surprising finding that highlights the need to protect the habitat of these critically endangered primates, which face rapid habitat destruction and threats linked to climate change.

Scientists found that the muscle mass of orangutans on the island of Borneo in Southeast Asia was significantly lower when less fruit was available. That’s remarkable because orangutans are thought to be especially good at storing and using fat for energy, according to a Rutgers-led study in the journal Scientific Reports.

The findings highlight that any further disruption of their fruit supply could have dire consequences for their health and survival.

“Conservation plans must consider the availability of fruit in forest patches or corridors that orangutans may need to occupy as deforestation continues across their range,” said lead author Caitlin A. O’Connell, a post-doctoral fellow in the lab of senior author Erin R. Vogel, Henry Rutgers Term Chair Professor and an associate professor in the Department of Anthropology and Center for Human Evolutionary Studies in the School of Arts and Sciences at Rutgers University-New Brunswick.

Jerry the Orangutan

A male orangutan nicknamed Jerry on the island of Borneo. Credit: Cecilia Mayer

Orangutans weigh up to about 180 pounds and live up to 55 years in the wild. One of our closest living relatives, they are the most solitary of the great apes, spending almost all of their time in trees. Orangutans in Borneo also spend some time on the ground. Deforestation linked to logging, the production of palm oil and paper pulp, and hunting all pose threats to orangutans, whose populations have plummeted in recent decades.

Orangutans also face great challenges in meeting their nutritional needs. With low and unpredictable fruit availability in their Southeast Asian forest habitats, they often struggle to eat enough to avoid calorie deficits and losing weight. Because these animals are critically endangered, researchers need to explore new ways to monitor their health without triggering more stress in them.

Researchers in Vogel’s Laboratory for Primate Dietary Ecology and Physiology measured creatinine, a waste product formed when muscle breaks down, in wild orangutan urine to estimate how much muscle the primates had when fruit was scarce versus when it was abundant.

In humans, burning through muscle as the main source of energy marks the third and final phase of starvation, which occurs after stores of body fat are greatly reduced. So, the research team was surprised to find that both males and females of all ages had reduced muscle mass when fruit availability was low compared with when it was high, meaning they had burned through most of their fat reserves and resorted to burning muscle mass.

“Orangutans seem to go through cycles of building fat and possibly muscle mass and then using fat and muscle for energy when preferred fruits are scarce and caloric intake is greatly reduced,” Vogel said. “Our team plans to investigate how other non-invasive measures of health vary with muscle mass and how the increasingly severe wildfires on Borneo might contribute to muscle loss and other negative health impacts.”

Reference: “Wild Bornean orangutans experience muscle catabolism during episodes of fruit scarcity” by Caitlin A. O’Connell, Andrea L. DiGiorgio, Alexa D. Ugarte, Rebecca S. A. Brittain, Daniel J. Naumenko, Sri Suci Utami Atmoko and Erin R. Vogel 13 May 2021, Scientific Reports.
DOI: 10.1038/s41598-021-89186-4

Rutgers co-authors include Andrea L. DiGiorgio, a lecturer at Princeton University and post-doctoral fellow in Vogel’s lab; Alexa D. Ugarte, the lab’s manager; Rebecca S. A. Brittain, a doctoral student in the lab; and Daniel Naumenko, a former Rutgers undergraduate student who is now at doctoral student at the University of Colorado Boulder. Scientists at New York University and Universitas Nasional in Indonesia contributed to the study.

Largest-Ever Effort to Artificially Inseminate Sharks – And the Occasional
Largest-Ever Effort to Artificially Inseminate Sharks – And the Occasional “Virgin Birth”
Baby Shark

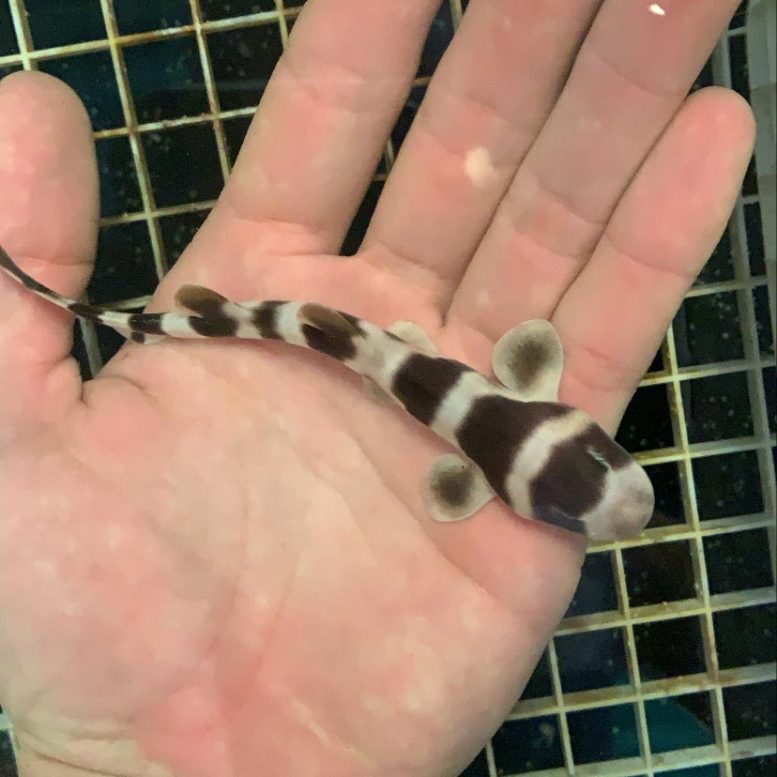
A baby bamboo shark born via artificial insemination. Credit: Photo by Jay Harvey, Aquarium of the Pacific

It’s a tough time to be a shark. Pollution, industrialized fishing, and climate change threaten marine life, and the populations of many top ocean predators have declined in recent years.

In addition to studying sharks in the wild, scientists working to save sharks rely on ones living in zoos and aquariums so that they can help build breeding programs and learn more about the conditions sharks need to thrive. One important way the scientists do that is by playing matchmakers to the sharks, pairing up individuals in ways that increase genetic diversity.

In a new study in Scientific Reports, scientists undertook the largest-ever effort to artificially inseminate sharks. Their work resulted in 97 new baby sharks, including ones whose parents live on opposite sides of the country and a few that don’t have fathers at all.

“Our goal was to develop artificial insemination as a tool that could be used to help support and maintain healthy reproducing populations of sharks in aquariums,” says Jen Wyffels, the paper’s lead author who conducted the research for this paper with the South-East Zoo Alliance for Reproduction & Conservation and is currently a researcher at the University of Delaware.

“Moving whole animals from one aquarium to another to mate is expensive and can be stressful for the animal, but now we can just move genes around through sperm,” says Kevin Feldheim, a researcher at Chicago’s Field Museum and a co-author of the study who led the DNA analysis of the newborn sharks to determine their parentage.

Shark Egg Cases

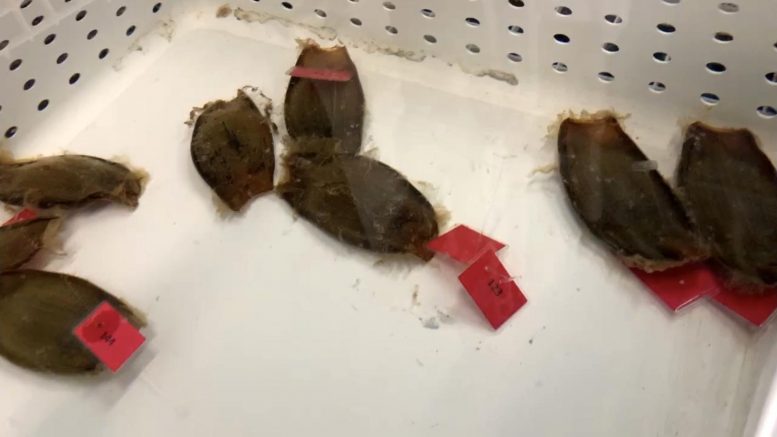
Egg cases (aka “mermaid’s purses”) laid by bamboo sharks and fertilized via artificial insemination. Credit: Photo by Jay Harvey, Aquarium of the Pacific

Figuring out shark parentage can be tricky because shark reproduction isn’t always straightforward. In some species, female sharks can store sperm for months after mating and they use it for fertilization “on demand,” so the father of a newborn shark isn’t necessarily the male the mother most recently had contact with. Some female sharks are even capable of reproducing with no male at all, a process called parthenogenesis. In parthenogenesis, the female’s egg cells are able to combine with each other, creating an embryo that only contains genetic material from the mother.

To study shark reproduction, the researchers focused on whitespotted bamboo sharks. “When people think of sharks, they picture great whites, tiger sharks, and bull sharks — the big, scary, charismatic ones,” says Feldheim. “Whitespotted bamboo sharks are tiny, about three feet long. If you go to an aquarium, they’re generally just resting on the bottom.” But while bamboo sharks’ gentleness and small size make them unlikely candidates for Hollywood fame, those qualities make them ideal for researchers to try to artificially inseminate.

Before attempting artificial insemination, researchers have to make sure that the potential mothers aren’t already carrying sperm from a previous rendezvous. “Candidate females are isolated from males and the eggs they lay afterwards are monitored to make sure they are infertile,” says Wyffels. Egg-laying sharks regularly lay eggs on a regular schedule, much like chickens, says Wyffels, to the point that they’re nicknamed “chickens of the sea.” To determine if the eggs are infertile, scientists shine an underwater light through the leathery, rectangular egg cases (called “mermaid’s purses”) to see if there’s a wriggling embryo on top of the yolk. If there are no fertilized eggs for six weeks or more, the shark is ready to be inseminated.

Baby Sharks

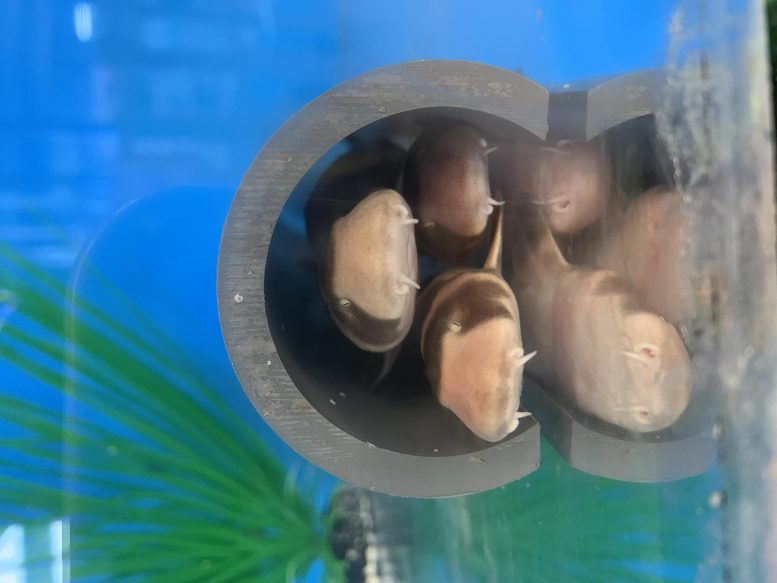
A group of bamboo shark hatchlings in a tube. Credit: Photo by Jay Harvey, Aquarium of the Pacific

Scientists collected and evaluated 82 semen samples from 19 sharks in order to tell the difference between good and bad samples. Some of the good samples went to nearby females for insemination, while others were kept cold and shipped around and across the country. Once the semen reached Ripley’s Aquarium of the Smokies or Aquarium of the Pacific, where a female was waiting, researchers sedated her and placed the semen in her reproductive tract — the procedure took less than ten minutes. All in all, 20 females were inseminated as part of the study.

Baby sharks hatched from fertilized eggs after 4 months of incubation. “The hatchlings are about the size of your hand, and they have distinctive spot patterns that help to tell them apart,” says Wyffels. Tissue samples were taken from all the babies, along with their parents, so Feldheim could analyze their DNA at the Field Museum’s Pritzker Laboratory for Molecular Systematics and Evolution.

Feldheim developed a suite of genetic markers to determine parentage. “We sequenced the DNA and found sections where the code repeats itself,” says Feldheim. “These repeating bits of code serve as signatures, and when we see them in the babies, we match them up to the potential dads.” The team found that freshly collected semen was effective in fertilizing eggs in 27.6% of cases; semen that had been cold-stored for 24 or 48 hours had 28.1% and 7.1% success rates, respectively. In the genetic analysis of the offspring, the team also found two instances of parthenogenesis, where the mother reproduced on her own without using the sperm she’d been inseminated with. “These cases of parthenogenesis were unexpected and help illustrate how little we know about the basic mechanisms of sexual reproduction and embryo development among sharks,” says Wyffels.

From these preliminary results, the scientists hope to help aquariums expand and manage their shark breeding programs. “There have been other reports on artificial insemination of sharks, but they include very few females. In this study, we’re in the double digits and as a result we could investigate different methods for preparing and preserving sperm for insemination” says Wyffels. “And a hatchling from shark parents that live almost 3,000 miles apart from sperm collected days in advance, that’s definitely a first.”

“One of the goals of this pilot project was to just see if it worked,” says Feldheim. “Now, we can extend it to other animals that actually need help breeding, from other species in aquariums to sharks under threat in the wild.”

The researchers also note that if studies like these contribute to the conservation of sharks in the wild, it will be largely thanks to aquariums. “We wouldn’t know about parthenogenesis in sharks if it wasn’t for aquariums,” says Feldheim.

“Aquariums allow you to observe the same individual animals over time, and that’s very difficult to do in the wild,” says Wyffels. “Aquarists have eyes on their animals every day. They pick up on subtle changes in behavior related to reproduction, and they tell us what they see. Research like this depends on that collaboration. We are already taking what we learned from this study and applying it to other species, especially the sand tiger shark, a protected species that does not reproduce often in aquariums.”

Reference: “Artificial insemination and parthenogenesis in the whitespotted bamboo shark Chiloscyllium plagiosum” by Jennifer T. Wyffels, Lance M. Adams, Frank Bulman, Ari Fustukjian, Michael W. Hyatt, Kevin A. Feldheim & Linda M. Penfold 13 May 2021, Scientific Reports.
DOI: 10.1038/s41598-021-88568-y

This study was led by researchers from the South-East Zoo Alliance for Reproduction & Conservation in collaboration with, the Aquarium of the Pacific, Ripley’s Aquarium of the Smokies, The Florida Aquarium, Adventure Aquarium and the Field Museum.

Hear the Eerie Sounds of Interstellar Space Captured by NASA's Voyager
Hear the Eerie Sounds of Interstellar Space Captured by NASA’s Voyager
Voyager 1 Fires Up Thrusters After 37 Years

An illustration depicting one of NASA’s twin Voyager spacecraft. Both Voyagers have entered interstellar space, or the space outside our Sun’s heliosphere. Credit: NASA/JPL-Caltech

As NASA’s Voyager 1 Surveys Interstellar Space, Its Density Measurements Are Making Waves

In the sparse collection of atoms that fills interstellar space, Voyager 1 has measured a long-lasting series of waves where it previously only detected sporadic bursts.

Until recently, every spacecraft in history had made all of its measurements inside our heliosphere, the magnetic bubble inflated by our Sun. But on August 25, 2012, NASA’s Voyager 1 changed that. As it crossed the heliosphere’s boundary, it became the first human-made object to enter – and measure – interstellar space. Now eight years into its interstellar journey, a close listen of Voyager 1’s data is yielding new insights into what that frontier is like.

If our heliosphere is a ship sailing interstellar waters, Voyager 1 is a life raft just dropped from the deck, determined to survey the currents. For now, any rough waters it feels are mostly from our heliosphere’s wake. But farther out, it will sense the stirrings from sources deeper in the cosmos. Eventually, our heliosphere’s presence will fade from its measurements completely.

Voyager 2 Nearing Interstellar Space

This graphic from October 20218 shows the position of the Voyager 1 and Voyager 2 probes relative to the heliosphere, a protective bubble created by the Sun that extends well past the orbit of Pluto. Voyager 1 crossed the heliopause, or the edge of the heliosphere, in 2012. Voyager 2 is still in the heliosheath, or the outermost part of the heliosphere. (NASA’s Voyager 2 spacecraft entered interstellar space in November 2018.) Credits: NASA/JPL-Caltech

“We have some ideas about how far Voyager will need to get to start seeing more pure interstellar waters, so to speak,” said Stella Ocker, a Ph.D. student at Cornell University in Ithaca, New York, and the newest member of the Voyager team. “But we’re not entirely sure when we’ll reach that point.”

Ocker’s new study, published on Monday in Nature Astronomy, reports what may be the first continuous measurement of the density of material in interstellar space. “This detection offers us a new way to measure the density of interstellar space and opens up a new pathway for us to explore the structure of the very nearby interstellar medium,” Ocker said.

NASA’s Voyager 1 spacecraft captured these sounds of interstellar space. Voyager 1’s plasma wave instrument detected the vibrations of dense interstellar plasma, or ionized gas, from October to November 2012 and April to May 2013. Credit: NASA/JPL-Caltech

When one pictures the stuff between the stars – astronomers call it the “interstellar medium,” a spread-out soup of particles and radiation – one might reimagine a calm, silent, serene environment. That would be a mistake.

“I have used the phrase ‘the quiescent interstellar medium’ – but you can find lots of places that are not particularly quiescent,” said Jim Cordes, space physicist at Cornell and co-author of the paper.

Like the ocean, the interstellar medium is full of turbulent waves. The largest come from our galaxy’s rotation, as space smears against itself and sets forth undulations tens of light-years across. Smaller (though still gigantic) waves rush from supernova blasts, stretching billions of miles from crest to crest. The smallest ripples are usually from our own Sun, as solar eruptions send shockwaves through space that permeate our heliosphere’s lining.

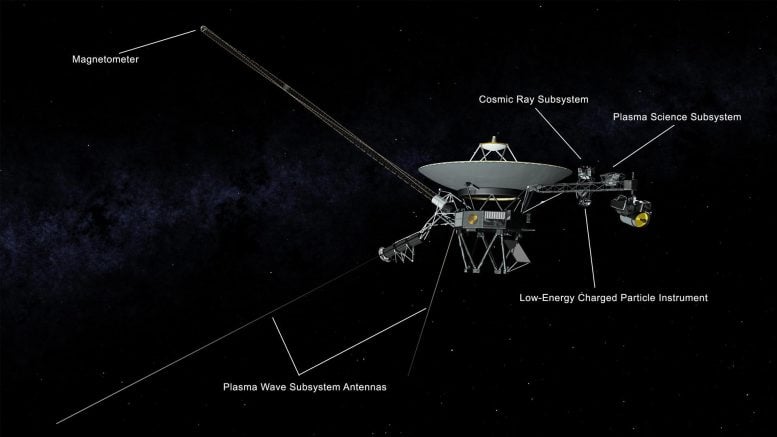
These crashing waves reveal clues about the density of the interstellar medium – a value that affects our understanding of the shape of our heliosphere, how stars form, and even our own location in the galaxy. As these waves reverberate through space, they vibrate the electrons around them, which ring out at characteristic frequencies depending on how crammed together they are. The higher the pitch of that ringing, the higher the electron density. Voyager 1’s Plasma Wave Subsystem – which includes two “bunny ear” antennas sticking out 30 feet (10 meters) behind the spacecraft – was designed to hear that ringing.

Voyager 2 Spacecraft Instruments

An illustration of NASA’s Voyager spacecraft showing the antennas used by the Plasma Wave Subsystem and other instruments. Credit: NASA/JPL-Caltech

In November 2012, three months after exiting the heliosphere, Voyager 1 heard interstellar sounds for the first time (see video above). Six months later, another “whistle” appeared – this time louder and even higher pitched. The interstellar medium appeared to be getting thicker, and quickly.

These momentary whistles continue at irregular intervals in Voyager’s data today. They’re an excellent way to study the interstellar medium’s density, but it does take some patience.

“They’ve only been seen about once a year, so relying on these kinds of fortuitous events meant that our map of the density of interstellar space was kind of sparse,” Ocker said.

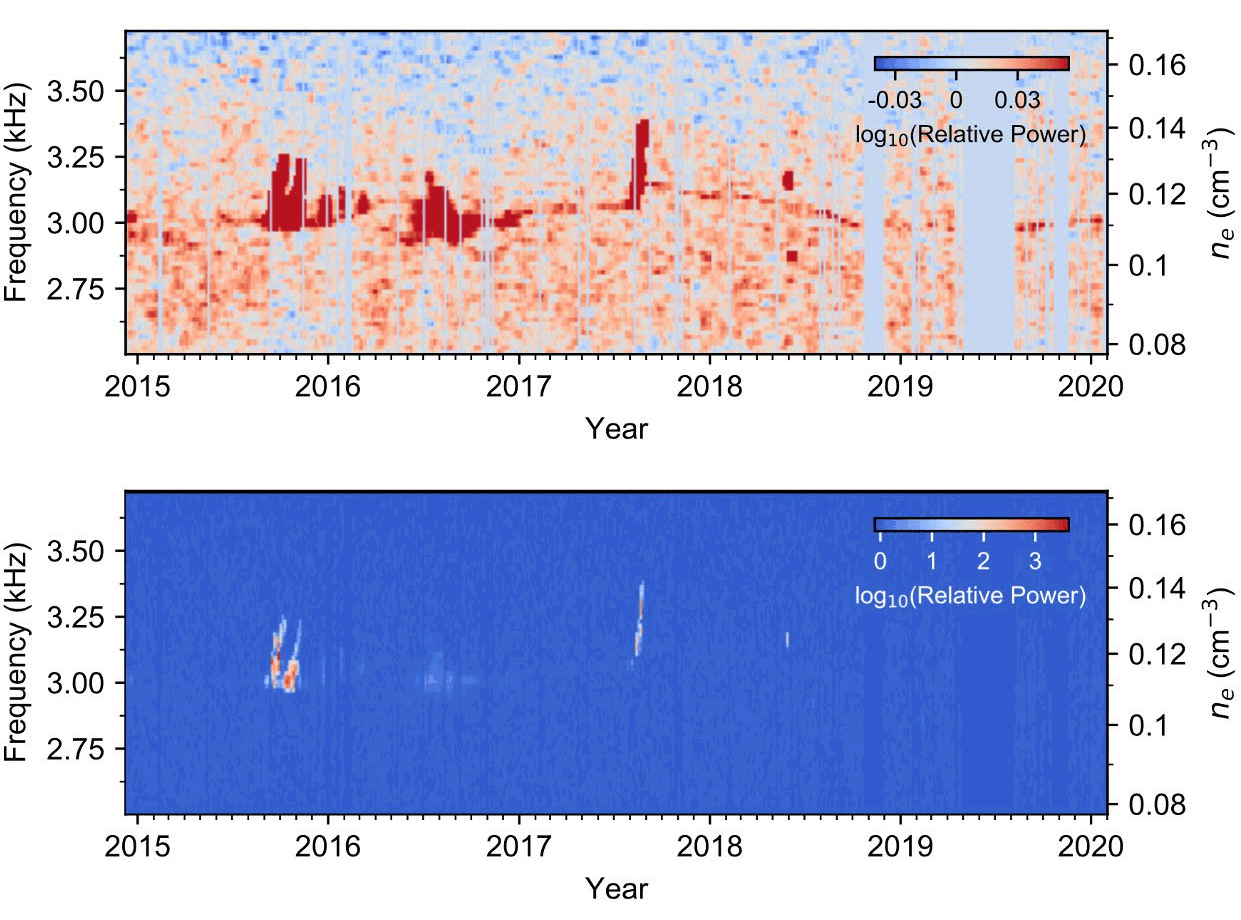
Ocker set out to find a running measure of interstellar medium density to fill in the gaps – one that doesn’t depend on the occasional shockwaves propagating out from the Sun. After filtering through Voyager 1’s data, looking for weak but consistent signals, she found a promising candidate. It started to pick up in mid-2017, right around the time of another whistle.

“It’s virtually a single tone,” said Ocker. “And over time, we do hear it change – but the way the frequency moves around tells us how the density is changing.”

Plasma Oscillation Events

Weak but nearly continuous plasma oscillation events – visible as a thin red line in this graphic/tk – connect stronger events in Voyager 1’s Plasma Wave Subsystem data. The image alternates between graphs showing only the strong signals (blue background) and the filtered data showing weaker signals. Credit: NASA/JPL-Caltech/Stella Ocker

Ocker calls the new signal a plasma wave emission, and it, too, appeared to track the density of interstellar space. When the abrupt whistles appeared in the data, the tone of the emission rises and falls with them. The signal also resembles one observed in Earth’s upper atmosphere that’s known to track with the electron density there.

“This is really exciting, because we are able to regularly sample the density over a very long stretch of space, the longest stretch of space that we have so far,” said Ocker. “This provides us with the most complete map of the density and the interstellar medium as seen by Voyager.”

Based on the signal, electron density around Voyager 1 started rising in 2013 and reached its current levels about mid-2015, a roughly 40-fold increase in density. The spacecraft appears to be in a similar density range, with some fluctuations, through the entire dataset they analyzed which ended in early 2020.

Ocker and her colleagues are currently trying to develop a physical model of how the plasma wave emission is produced that will be key to interpreting it. In the meantime, Voyager 1’s Plasma Wave Subsystem keeps sending back data farther and farther from home, where every new discovery has the potential to make us reimagining our home in the cosmos.

For more on this research, read In the Emptiness of Space 14 Billion Miles Away, Voyager I Detects “Hum” From Plasma Waves.

Reference: “Persistent plasma waves in interstellar space detected by Voyager 1” by Stella Koch Ocker, James M. Cordes, Shami Chatterjee, Donald A. Gurnett, William S. Kurth and Steven R. Spangler, 10 May 2021, Nature Astronomy.
DOI: 10.1038/s41550-021-01363-7

The Voyager spacecraft were built by NASA’s Jet Propulsion Laboratory, which continues to operate both. JPL is a division of Caltech in Pasadena. The Voyager missions are a part of the NASA Heliophysics System Observatory, sponsored by the Heliophysics Division of the Science Mission Directorate in Washington.
DNA Analysis Identifies First Member of Ill-Fated 1845 Franklin Expedition
John Gregory, HMS Erebus

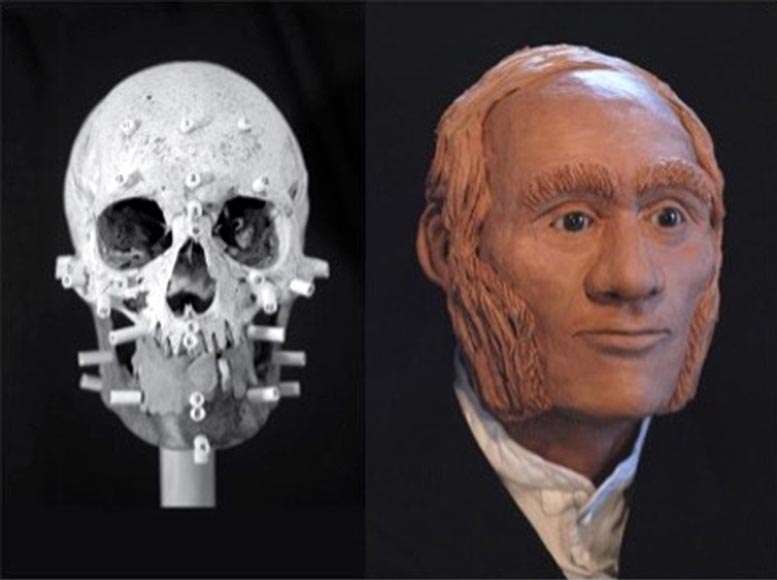
Facial reconstruction of individual identified through DNA analysis as John Gregory, HMS Erebus. Credit: Diana Trepkov/ University of Waterloo

With a living descendant’s DNA sample, a team of researchers have identified the remains of John Gregory, engineer aboard HMS Erebus.

The identity of the skeletal remains of a member of the 1845 Franklin expedition has been confirmed using DNA and genealogical analyses by a team of researchers from the University of Waterloo, Lakehead University, and Trent University. This is the first member of the ill-fated expedition to be positively identified through DNA.

DNA extracted from tooth and bone samples recovered in 2013 were confirmed to be the remains of Warrant Officer John Gregory, engineer aboard HMS Erebus. The results matched a DNA sample obtained from a direct descendant of Gregory.

Douglas Stenton Excavating Unidentified Sailor

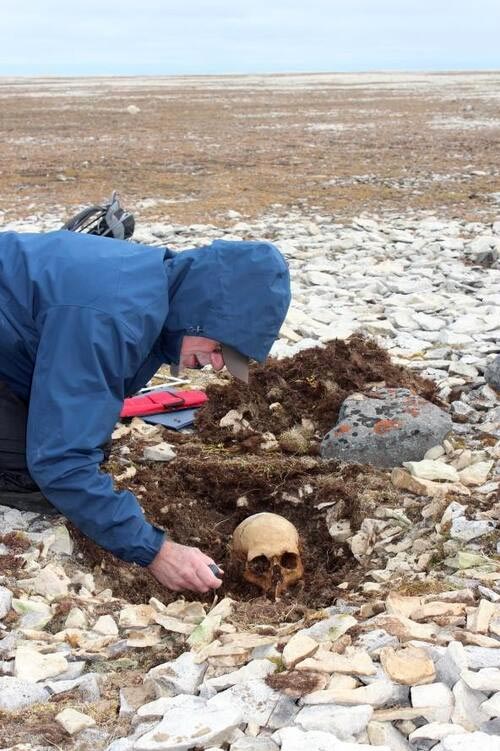
Douglas Stenton excavating an as-yet unidentified sailor whose remains were found with those of John Gregory. Credit: Robert W. Park/ University of Waterloo

The remains of the officer were found on King William Island, Nunavut. “We now know that John Gregory was one of three expedition personnel who died at this particular site, located at Erebus Bay on the southwest shore of King William Island,” says Douglas Stenton, adjunct professor of anthropology at Waterloo and co-author of a new paper about the discovery.

“Having John Gregory’s remains being the first to be identified via genetic analysis is an incredible day for our family, as well as all those interested in the ill-fated Franklin expedition,” said Gregory’s great-great-great grandson Jonathan Gregory of Port Elizabeth, South Africa. “The whole Gregory family is extremely grateful to the entire research team for their dedication and hard work, which is so critical in unlocking pieces of history that have been frozen in time for so long.”

Sir John Franklin’s 1845 northwest passage expedition, with 129 sailors on two ships, Erebus and Terror, entered the Arctic in 1845. In April 1848, 105 survivors abandoned their ice-trapped ships in a desperate escape attempt. None would survive. Since the mid-19th century, skeletal remains of dozens of crew members have been found on King William Island, but none had been positively identified.

To date, the DNA of 26 other members of the Franklin expedition have been extracted from remains found in nine archaeological sites situated along the line of the 1848 retreat. “Analysis of these remains has also yielded other important information on these individuals, including their estimated age at death, stature, and health,” says Anne Keenleyside, Trent anthropology professor and co-author of the paper.

“We are extremely grateful to the Gregory family for sharing their family history with us and for providing DNA samples in support of our research. We’d like to encourage other descendants of members of the Franklin expedition to contact our team to see if their DNA can be used to identify the other 26 individuals,” says Stenton.

Commemorative Cairn at Erebus Bay

Commemorative cairn at Erebus Bay constructed in 2014. The cairn contains the remains of John Gregory and two other members of the 1845 Franklin expedition. Credit: Diana Trepkov/ University of Waterloo

Genealogical records indicated a direct, five-generation paternal relationship between the living descendant and John Gregory. “It was fortunate that the samples collected contained well-preserved genetic material, says Stephen Fratpietro of Lakehead’s Paleo-DNA lab, who is a co-author.

Prior to this DNA match, the last information about his voyage known to Gregory’s family was in a letter he wrote to his wife Hannah from Greenland on 9 July 1845 before the ships entered the Canadian Arctic.

This latest discovery helps to complete the story of the Franklin victims, says Robert Park, Waterloo anthropology professor and co-author. “The identification proves that Gregory survived three years locked in the ice on board HMS Erebus. But he perished 75 kilometers south at Erebus Bay.”

The remains of Gregory and two others were first discovered in 1859 and buried in 1879. The grave was rediscovered in 1993, and in 1997 several bones that had been exposed through disturbance of the grave were placed in a cairn with a commemorative plaque. The grave was then excavated in 2013 and after being analyzed, all the remains were returned to the site in 2014 and placed in a new larger memorial cairn.

Reference: “DNA identification of a sailor from the 1845 Franklin northwest passage expedition” by Douglas R. Stenton, Stephen Fratpietro, Anne Keenleyside and Robert W. Park, 28 April 2021, Polar Record.
DOI: 10.1017/S0032247421000061

DNA identification of a sailor from the 1845 Franklin Northwest Passage Expedition by Stenton, Park, Fratpietro, and Keenleyside was published in the journal Polar Record. The research was funded by the Government of Nunavut, Trent University and the University of Waterloo. Descendants of members of the Franklin expedition can contact Douglas Stenton or Anne Keenleyside.

Handheld
Handheld “MasSpec Pen” Reveals Meat and Fish Fraud in Seconds
MasSpec Pen

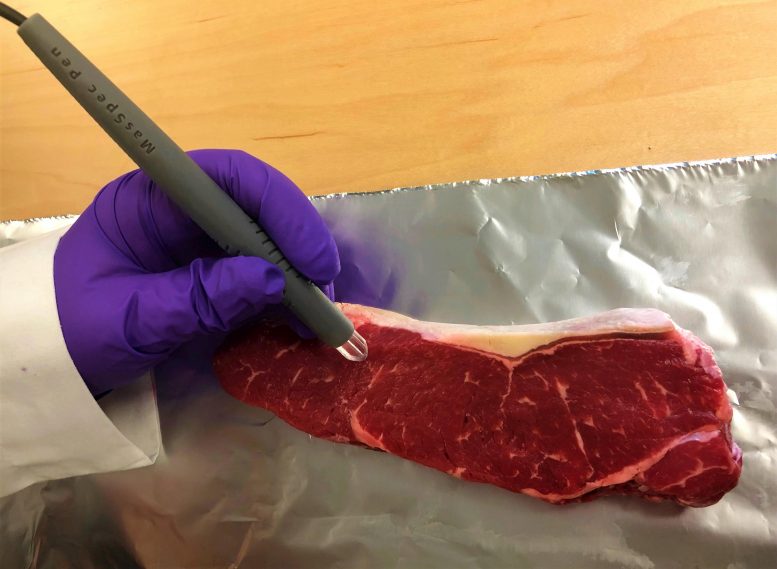
The MasSpec Pen can authenticate the type and purity of meat samples in as little as 15 seconds. Credit: Adapted from Journal of Agricultural and Food Chemistry 2021, DOI: 10.1021/acs.jafc.0c07830

Meat and fish fraud are global problems, costing consumers billions of dollars every year. On top of that, mislabeling products can cause problems for people with allergies, religious or cultural restrictions. Current methods to detect this fraud, while accurate, are slower than inspectors would like. Now, researchers reporting in ACS’ Journal of Agricultural and Food Chemistry have optimized their handheld MasSpec Pen to identify common types of meat and fish within 15 seconds.

News stories of food fraud, such as beef being replaced with horse meat, and cheaper fish being branded as premium fillets, have led people to question if what is on the label is actually in the package. To combat food adulteration, the U.S. Department of Agriculture conducts regular, random inspections of these products.

Although current molecular techniques, such as the polymerase chain reaction (PCR), are highly accurate, these analyses can take hours to days, and are often performed at off-site labs. Previous studies have devised more direct and on-site food analysis methods with mass spectrometry, using the amounts of molecular components to verify meat sources, but they also destroyed samples during the process or required sample preparation steps.

More recently, Livia Eberlin and colleagues developed the MasSpec Pen — a handheld device that gently extracts compounds from a material’s surface within seconds and then analyzes them on a mass spectrometer. So, the team wanted to see whether this device could rapidly and effectively detect meat and fish fraud in pure filets and ground products.

The researchers used the MasSpec Pen to examine the molecular composition of grain-fed and grass-fed beef, chicken, pork, lamb, venison, and five common fish species collected from grocery stores. Once the device’s tip was pressed against a sample, a 20-μL droplet of solvent was released, extracting sufficient amounts of molecules within three seconds for accurate analysis by mass spectrometry. The whole process took 15 seconds, required no preprocessing, and the liquid extraction did not harm the samples’ surfaces.

Then the team developed authentication models using the unique patterns of the molecules identified, including carnosine, anserine, succinic acid, xanthine and taurine, to distinguish pure meat types from each other, beef based on feeding habit and among the five fish species.

Finally, the researchers applied their models to the analysis of test sets of meats and fish. For these samples, all models had a 100% accuracy identifying the protein source, which is as good as the current method of PCR and approximately 720 times faster.

The researchers say they plan to expand the method to other meat products and integrate the MasSpec Pen into a portable mass spectrometer for on-site meat authentication.

Reference: “Rapid Analysis and Authentication of Meat Using the MasSpec Pen Technology” by Abigail N. Gatmaitan, John Q. Lin, Jialing Zhang and Livia S. Eberlin, 10 March 2021, Journal of Agricultural and Food Chemistry.
DOI: 10.1021/acs.jafc.0c07830

The authors acknowledge funding from the Welch Foundation and the Gordon and Betty Moore Foundation.

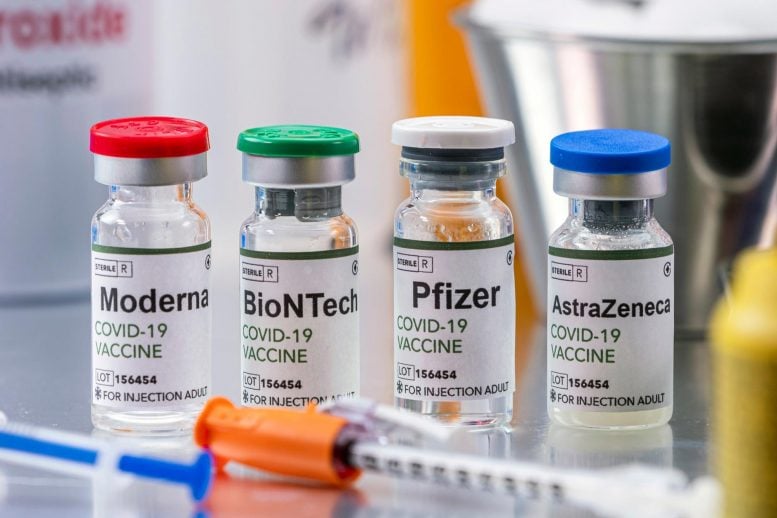
Preliminary Data Suggests Mixing COVID-19 Vaccines Increases Frequency of Adverse Reactions

COVID 19 Vaccines

  • Research, from Com-COV study comparing mixed dosing schedules of Pfizer / Oxford-AstraZeneca vaccines, shows increase in the frequency of mild-moderate symptoms in those receiving either mixed dosing schedule
  • Adverse reactions were short-lived, with no other safety concerns
  • Impact of mixed schedules on immunogenicity unknown as yet, with data to follow from this study

Researchers running the University of Oxford-led Com-COV study — launched earlier this year to investigate alternating doses of the Oxford-AstraZeneca vaccine and the Pfizer vaccine — have today reported preliminary data revealing more frequent mild to moderate reactions in mixed schedules compared to standard schedules.

Writing in a peer-reviewed Research Letter published in the Lancet, they report that, when given at a four-week interval, both of the ‘mixed’ schedules (Pfizer-BioNTech followed by Oxford-AstraZeneca, and Oxford-AstraZeneca followed by Pfizer-BioNTech) induced more frequent reactions following the 2nd, ‘boost’ dose than the standard, ‘non-mixed’ schedules. They add that any adverse reactions were short-lived and there were no other safety concerns.

Matthew Snape, Associate Professor in Paediatrics and Vaccinology at the University of Oxford, and Chief Investigator on the trial, said:

“Whilst this is a secondary part of what we are trying to explore through these studies, it is important that we inform people about these data, especially as these mixed-doses schedules are being considered in several countries. The results from this study suggest that mixed dose schedules could result in an increase in work absences the day after immunization, and this is important to consider when planning immunization of health care workers.

“Importantly, there are no safety concerns or signals, and this does not tell us if the immune response will be affected. We hope to report these data in the coming months. In the meantime, we have adapted the ongoing study to assess whether early and regular use of paracetamol reduces the frequency of these reactions.”

They also noted that as the study data was recorded in participants aged 50 and above, there is a possibility such reactions may be more prevalent in younger age groups.

Reference: 13 May 2021, The Lancet.

About the Com-Cov trial:

The study has been classified as an Urgent Public Health study by the NIHR and is being undertaken by NISEC and the Oxford Vaccine Group, with funding of £7 million from the government through the Vaccines Taskforce.

The University of Oxford is leading the study, run by the National Immunisation Schedule Evaluation Consortium (NISEC) and backed by £7 million of government funding from the Vaccines Taskforce.

It aims to evaluate the feasibility of using a different vaccine for the initial ‘prime’ vaccination to the follow-up ‘booster’ vaccination, helping policymakers explore whether this could be a viable route to increase the flexibility of vaccination programs.

The trial recruited 830 volunteers aged 50 and above from eight National Institute for Health Research (NIHR) supported sites in England to evaluate the four different combinations of prime and booster vaccination: a first dose of the Oxford-AstraZeneca vaccine followed by boosting with either the Pfizer vaccine or a further dose of the Oxford-AstraZeneca vaccine, or a first dose of the Pfizer vaccine followed by boosting with either the Oxford-AstraZeneca vaccine or a further dose of the Pfizer vaccine.

In April, the researchers expanded the program to include the Moderna and Novavax vaccines in a new study (Com-Cov2), run across nine National Institute for Health Research supported sites by NISEC and backed through funding from the Vaccines Taskforce and the Coalition for Epidemic Preparedness Innovations. Volunteers would have received either the Oxford-AstraZeneca or Pfizer vaccine, and then randomly allocated to receive either the same vaccine for their second dose or a dose of the COVID-19 vaccines produced by Moderna or Novavax.

The six new ‘arms’ of the trial each aimed to recruit 175 candidates, adding a further 1050 recruits into this program.

Both studies are designed as so-called ‘non-inferiority’ studies — the intent is to demonstrate that mixing is not substantially worse than not mixing — and will compare the immune system responses to the gold-standard responses reported in previous clinical trials of each vaccine.

About the Oxford Vaccine Group

The Oxford Vaccine Group (OVG) conducts studies of new and improved vaccines for children and adults and is based in the Department of Paediatrics at the University of Oxford. The multidisciplinary group includes consultants in vaccinology, a Director of Clinical Trials, a Senior Clinical Trials Manager, adult and pediatric clinical research fellows, adult and pediatric research nurses, project managers, statisticians, QA manager, Clinical Trials IT and Development Lead, and an administration team. The team also includes post-doctoral scientists, research assistants, and DPhil students and we work together with professionals from a range of specialties such as immunologists, microbiologists, epidemiologists, health communicators, and a sociologist, a community pediatrician, the local Health Protection team, and a bioethicist.

OVG is a UKCRC registered clinical trials unit working in collaboration with the Primary Care Trials Unit at the University (registration number: 52).

About the National Institute for Health Research

The National Institute for Health Research (NIHR) is the nation’s largest funder of health and care research. The NIHR was established in 2006 to improve the health and wealth of the nation through research, and is funded by the Department of Health and Social Care. In addition to its national role, the NIHR commissions applied health research to benefit the poorest people in low- and middle-income countries, using Official Development Assistance funding.

About the Vaccines Taskforce

The Vaccines Taskforce (VTF) is a joint unit in the Department for Business, Energy and Industrial Strategy (BEIS) and Department for Health and Social Care (DHSC). The VTF was set up to ensure that the UK population has access to clinically effective and safe vaccines as soon as possible, while working with partners to support international access to successful vaccines.

The Vaccines Taskforce comprises a dedicated team of private sector industry professionals and officials from across government who are working at speed to build a portfolio of promising vaccine candidates that can end the global pandemic.

The UK has secured early access to 517 million doses of eight of the most promising vaccine candidates. This includes agreements with:

  • BioNTech/Pfizer for 100 million doses
  • Valneva for 100 million doses
  • Oxford/AstraZeneca who will work to supply 100 million doses of the vaccine being developed by Oxford University
  • GlaxoSmithKline and Sanofi Pasteur to buy 60 million doses
  • Novavax for 60 million doses
  • Janssen for 30 million doses of their not-for-profit vaccine, alongside funding of their Phase 3 clinical trial
  • Moderna for 17 million doses
  • CureVac for 50 million doses

The Vaccines Taskforce’s approach to securing access to vaccines is through:

  • procuring the rights to a diverse range of promising vaccine candidates to spread risk and optimize chances for success
  • providing funding for clinical studies, diagnostic monitoring and regulatory support to rapidly evaluate vaccines for safety and efficacy
  • providing funding and support for manufacturing scale-up and fill and finish at risk so that the UK has vaccines produced at scale and ready for administration should any of these prove successful

About the University of Oxford

Oxford University has been placed number 1 in the Times Higher Education World University Rankings for the fifth year running, and at the heart of this success is our ground-breaking research and innovation.

Oxford is world-famous for research excellence and home to some of the most talented people from across the globe. Our work helps the lives of millions, solving real-world problems through a huge network of partnerships and collaborations. The breadth and interdisciplinary nature of our research sparks imaginative and inventive insights and solutions.

Through its research commercialization arm, Oxford University Innovation, Oxford is the highest university patent filer in the UK and is ranked first in the UK for university spinouts, having created more than 200 new companies since 1988. Over a third of these companies have been created in the past three years.

Study Shows New Obesity Treatment Semaglutide Reduces Body Weight Regardless of Patient Characteristics

Females and those with lower body weight have better results.

New research presented at this year’s European Congress on Obesity (held online, 10-13 May) shows that treatment with the drug semaglutide reduces body weight in adults with overweight or obesity, regardless of their baseline characteristics.

However, the study showed that female participants had slightly better results than males and also that participants with the lowest starting body weight responded slightly better than those with higher body weights. The study is by Professor Robert Kushner, Feinberg School of Medicine, Northwestern University, Chicago, IL, USA, and colleagues.

Semaglutide is already approved for treatment for type 2 diabetes in multiple countries, and is under development for treatment of obesity. The STEP trials published over the past year have established the efficacy and safety of semaglutide 2.4 mg in treating people with overweight and obesity. In this new analysis of data from the STEP 1 trial (see link below), the researchers investigated weight loss in subgroups of participants based on their baseline characteristics.

In STEP 1, adults without type 2 diabetes with either a body mass index (BMI) of at least 27 kg/m² plus one or more weight-related comorbidities, or a BMI of 30 kg/m² or above, were enrolled. Participants were randomized to a once-weekly injection of semaglutide 2.4 mg or placebo, both plus lifestyle intervention, for 68 weeks.

The authors looked at what proportions of the participants achieved different levels of weight loss with semaglutide from baseline to week 68 (?20%, 15-<20%, 10-<15%, or 5-<10%) when grouped by different baseline characteristics (age, sex, race [White, Asian, Black or African American, or other], body weight, BMI, waist circumference and glycaemic status [normal blood sugar, or pre-diabetes]). Mean percent weight loss with semaglutide from baseline to week 68 was analyzed separately by sex (male, female) and baseline body weight (?115 kg, 100-<115 kg, 90-<100 kg, <90 kg) subgroup.

The original study included 1,961 randomized participants (mean age 46 years, body weight 105.3 kg, BMI 37.9 kg/m²; 74.1% female). For categorical weight loss, the observed proportions of participants with ?20%, 15-<20%, 10-<15% and 5-<10% weight loss at week 68 were 34.8%, 19.9%, 20.0% and 17.6% with semaglutide vs 2.0%, 3.0%, 6.8% and 21.2% with placebo, respectively.

The distribution of participants across weight-loss groups did not appear to be affected by any baseline characteristics, except sex and baseline body weight. Mean percent weight loss at week 68 with semaglutide was greater among females (-18.4%) than males (-12.9%), and in participants with lower vs higher baseline body weight (-18.6% for participants with <90 kg body weight at baseline; -13.9% for participants with ?115 kg baseline body weight).

The authors conclude: “We found that weight loss with once-weekly injections of semaglutide 2.4 mg was seen in all subgroups evaluated and was generally not influenced by baseline characteristics. The exceptions were sex and baseline body weight; female sex and a low baseline body weight were associated with a slightly greater response to semaglutide. These data support the use of semaglutide 2.4 mg across a broad population of patients with overweight or obesity.”

No Lasting Benefit to Surgically Placed Tubes Over Antibiotics for Childhood Ear Infections

Surgery Children's Hospital

There is no long-term benefit to surgically placing tympanostomy tubes in a young child’s ears to reduce the rate of recurrent ear infections during the ensuing two years compared with giving oral antibiotics to treat ear infections, a randomized trial led by UPMC Children’s Hospital of Pittsburgh and University of Pittsburgh pediatrician-scientists determined.

The trial results, published today (May 12, 2021) in the New England Journal of Medicine, are among the first since the pneumococcal vaccine was added to pediatric vaccination schedules, providing updated evidence that may help shape pediatric guidelines on treating recurrent ear infections. Importantly, despite their greater use of antibiotics, the trial found no evidence of increased bacterial resistance among children in the medical-management group.

“Subjecting a young child to the risks of anesthesia and surgery, the possible development of structural changes of the tympanic membrane, blockage of the tube or persistent drainage through the tube for recurrent ear infections, which ordinarily occur less frequently as the child ages, is not something I would recommend in most instances,” said lead author Alejandro Hoberman, M.D., director of the Division of General Academic Pediatrics at UPMC Children’s Hospital and the Jack L. Paradise Endowed Professor of Pediatric Research at Pitt’s School of Medicine.

Alejandro Hoberman

Director of the Division of General Academic Pediatrics, UPMC Children’s Hospital and the Jack L. Paradise Endowed Professor of Pediatric Research, University of Pittsburgh School of Medicine. Credit: UPMC

“We used to often recommend tubes to reduce the rate of ear infections, but in our study, episodic antibiotic treatment worked just as well for most children,” he said. “Another theoretical reason to resort to tubes is to use topical ear drops rather than systemic oral antibiotics in subsequent infections in the hope of preventing the development of bacterial resistance, but in this trial, we did not find increased resistance with oral antibiotic use. So, for most children with recurrent ear infections, why undergo the risks, cost and nuisance of surgery?”

Next to the common cold, ear infections are the most frequently diagnosed illness in U.S. children. Ear infections can be painful, force lost time at work and school, and may cause hearing loss. Tympanostomy tube placement, which is a surgical procedure to insert tiny tubes into a child’s eardrums to prevent the accumulation of fluid, is the most common operation performed on children after the newborn period.

Hoberman and his team enrolled 250 children ages 6 to 35 months of age at UPMC Children’s Hospital, Children’s National Medical Center in Washington, D.C., and Kentucky Pediatric and Adult Research in Bardstown, Ky. All of the children had had medically verified recurrent ear infections and had received the pneumococcal conjugate vaccine. They were randomly assigned to receive “medical management,” which involved receiving oral antibiotics at the time of ear infections, or the surgical insertion of tubes and antibiotic ear drops. The children were followed for two years.

Overall, there were no differences between children in the two groups when it came to the rate or severity of ear infections. And, though the children in the medical management group received more antibiotics, there also was no evidence of increased antimicrobial resistance in samples taken from the children. The trial also didn’t find any difference between the two groups in the children’s quality of life or in the effect of the children’s illness on parents’ quality of life.

One short-term benefit of placing tympanostomy tubes was that, on average, it took about two months longer for a child to develop a first ear infection after tubes were placed, compared with children whose ear infections were managed with antibiotics.

Another finding of the trial was that the rate of ear infections among children in both groups fell with increasing age. The rate of infections was 2.6 times higher in children younger than 1 year, compared with the oldest children in the trial, those between 2 and 3 years, regardless of whether they received medical management or tube insertion.

“Most children outgrow ear infections as the Eustachian tube, which connects the middle-ear with the back of the throat, works better,” Hoberman said. “Previous studies of tubes were conducted before children were universally immunized with pneumococcal conjugate vaccine, which also has reduced the likelihood of recurrent ear infections. It’s important to recognize that most children outgrow ear infections as they grow older. However, we must appreciate that for the relatively few children who continue to meet criteria for recurrent ear infections — three in six months or four in one year — after having met those criteria initially, placement of tympanostomy tubes may well be beneficial.”

Reference: 12 May 2021, New England Journal of Medicine.
DOI: 10.1056/NEJMoa2027278

Additional study authors are Diego Preciado, M.D., Ph.D., and Daniel E. Felton, M.D., both of Children’s National Medical Center; Jack L. Paradise, M.D., David H. Chi, M.D., MaryAnn Haralam, M.S.N., C.R.N.P., Diana H. Kearney, R.N., C.C.R.C., Sonika Bhatnagar, M.D., M.P.H., Gysella B. Muñiz Pujalt, M.D., Timothy R. Shope, M.D., M.P.H., Judith M. Martin, M.D., Marcia Kurs-Lasky, M.S., Hui Liu, M.S., Kristin Yahner, M.S., Jong-Hyeon Jeong, Ph.D., Jennifer P. Nagg, R.N., Joseph E. Dohar, M.D., and Nader Shaikh, M.D., M.P.H., all of Pitt; Norman L. Cohen, M.D., and Brian Czervionke, M.D., both of UPMC Children’s Community Pediatrics; and Stan L. Block, M.D., of Kentucky Pediatric and Adult Research.

This research was funded by National Institute on Deafness and Other Communication Disorders grant NCT02567825.

New Research Shows COVID-19 Alters Gray Matter Volume in the Brain

Pointing Brain X-Ray

Covid-19 patients who receive oxygen therapy or experience fever show reduced gray matter volume in the frontal-temporal network of the brain, according to a new study led by researchers at Georgia State University and the Georgia Institute of Technology.

The study found lower gray matter volume in this brain region was associated with a higher level of disability among Covid-19 patients, even six months after hospital discharge.

Gray matter is vital for processing information in the brain and gray matter abnormality may affect how well neurons function and communicate. The study, published in the May 2021 issue of Neurobiology of Stress, indicates gray matter in the frontal network could represent a core region for brain involvement in Covid-19, even beyond damage related to clinical manifestations of the disease, such as stroke.

The researchers, who are affiliated with the Center for Translational Research in Neuroimaging and Data Science (TReNDS), analyzed computed tomography scans in 120 neurological patients, including 58 with acute Covid-19 and 62 without Covid-19, matched for age, gender and disease. The work was done jointly with Enrico Premi and his colleagues at the University of Brescia in Italy, who provided the data for the study. They used source-based morphometry analysis, which boosts the statistical power for studies with a moderate sample size.

Kuaikuai Duan and Vince Calhoun

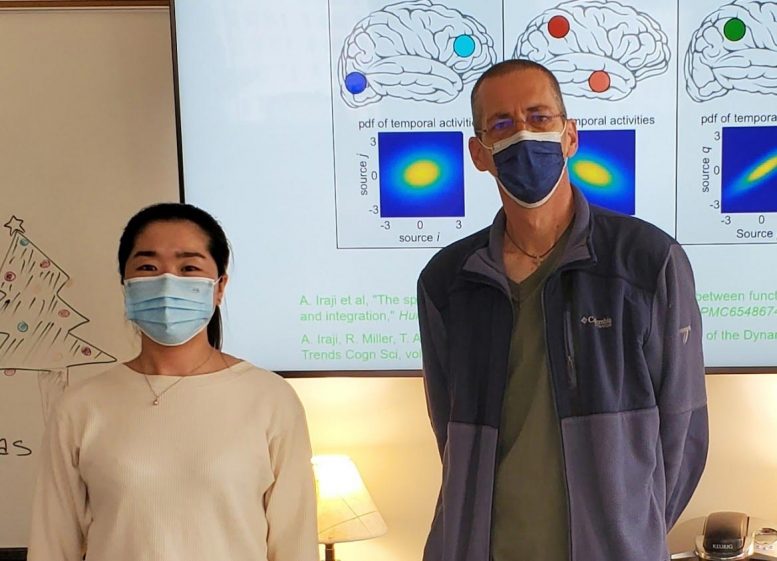
Researchers Kuaikuai Duan and Vince Calhoun have found that neurological complications of Covid-19 patients may be linked to lower gray matter volume in the front region of the brain even six months after hospital discharge. Credit: Vince Calhoun, Georgia Tech

“Science has shown that the brain’s structure affects its function, and abnormal brain imaging has emerged as a major feature of Covid-19,” said Kuaikuai Duan, the study’s first author, a graduate research assistant at TReNDS and Ph.D. student in Georgia Tech’s School of Electrical and Computer Engineering. “Previous studies have examined how the brain is affected by Covid-19 using a univariate approach, but ours is the first to use a multivariate, data-driven approach to link these changes to specific Covid-19 characteristics (for example fever and lack of oxygen) and outcome (disability level).”

The analysis showed patients with higher levels of disability had lower gray matter volume in the superior, medial and middle frontal gyri at discharge and six months later, even when controlling for cerebrovascular diseases. Gray matter volume in this region was also significantly reduced in patients receiving oxygen therapy compared to patients not receiving oxygen therapy. Patients with fever had a significant reduction in gray matter volume in the inferior and middle temporal gyri and the fusiform gyrus compared to patients without fever. The results suggest Covid-19 may affect the frontal-temporal network through fever or lack of oxygen.

Reduced gray matter in the superior, medial, and middle frontal gyri was also present in patients with agitation compared to patients without agitation. This implies that gray matter changes in the frontal region of the brain may underlie the mood disturbances commonly exhibited by Covid-19 patients.

“Neurological complications are increasingly documented for patients with Covid-19,” said Vince Calhoun, senior author of the study and director of TReNDS. Calhoun is Distinguished University Professor of Psychology at Georgia State and holds appointments in the School of Electrical and Computer Engineering at Georgia Tech and in neurology and psychiatry at Emory University. “A reduction of gray matter has also been shown to be present in other mood disorders such as schizophrenia and is likely related to the way that gray matter influences neuron function.”

The study’s findings demonstrate changes to the frontal-temporal network could be used as a biomarker to determine the likely prognosis of Covid-19 or evaluate treatment options for the disease. Next, the researchers hope to replicate the study on a larger sample size that includes many types of brain scans and different populations of Covid-19 patients.

Reference: “Alterations of frontal-temporal gray matter volume associate with clinical measures of older adults with COVID-19” by Kuaikuai Duan, Enrico Premi, Andrea Pilotto, Viviana Cristillo, Alberto Benussi, Ilenia Libri, Marcello Giunta, H. Jeremy Bockholt, Jingyu Liu, Riccardo Campora, Alessandro Pezzini, Roberto Gasparotti, Mauro Magoni, Alessandro Padovani and Vince D. Calhoun, 13 April 2021, Neurobiology of Stress.
DOI: 10.1016/j.ynstr.2021.100326

TReNDS is a partnership among Georgia State, Georgia Tech and Emory University and is focused on improving our understanding of the human brain using advanced analytic approaches. The center uses large-scale data sharing and multi-modal data fusion techniques, including deep learning, genomics, brain mapping and artificial intelligence.

Genetic Risk of Heart Disease May Be Due to Low Omega 3-Linked Biomarker Found in Fish Oils

Omega-3 Food Sources

People who are genetically more likely to suffer from cardiovascular diseases may benefit from boosting a biomarker found in fish oils, a new study suggests.

In a genetic study in 1,886 Asian Indians published in PLOS ONE today (Wednesday, May 12, 2021), scientists have identified the first evidence for the role of adiponectin, an obesity-related biomarker, in the association between a genetic variation called omentin and cardiometabolic health.

The team, led by Professor Vimal Karani from the University of Reading, observed that the role of adiponectin was linked to cardiovascular disease markers that were independent of common and central obesity among the Asian Indian population.

Prof Vimal Karani, Professor of Nutrigenetics and Nutrigenomics at the University of Reading said:

“This is an important insight into one way that people who are not obese may develop heart disease, through low concentrations of a biomarker in the body called adiponectin. It may also demonstrate why certain lifestyle factors such as consumption of oily fish and regular exercise are so important for warding off the risk of heart disease.

“We studied Asian Indian populations who have a particular genetic risk of developing heart disease and did see that the majority of our participants were already cardiometabolically unhealthy. However, the omentin genetic variation that we studied is prevalent across diverse ethnic groups and warrants further work to see whether omentin is playing a role in heart disease risk in other groups too.”

The Asian Indian population who took part in the study were found to have a significant association between low levels of adiponectin and cardiovascular disease, even after adjusting for factors normally linked with heart disease.

Participants in the study were screened and assessed based on a range of cardiovascular measures including BMI, fasting blood sugar, and cholesterol, and more than 80% of those who took part being assessed as cardiometabolically unhealthy.

Further analysis showed that those with genetic variation in omentin production also had less of the biomarker adiponectin in their body.

Professor Vimal Karani said:

“What we can see clearly from the observations is that there is a three-stage process going on where the omentin gene difference is contributing to the low biomarker adiponectin, which in turn seems to be linked to worse outcomes and risk of heart disease.

“The omentin gene itself works to produce a protein in the body that has been shown to have anti-inflammatory and cardioprotective effects, and variations in the omentin gene have previously linked to cardiometabolic diseases. The findings suggests that people can develop cardiometabolic diseases due to this specific omentin genetic risk, if they have low levels the biomarker adiponectin.”

Reference: 12 May 2021, PLOS ONE.
DOI: 10.1371/journal.pone.0238555

Funding: The Chennai Willingdon Corporate Foundation supported the CURES field studies.

Tracking Carbon From the Ocean Surface to the Dark
Tracking Carbon From the Ocean Surface to the Dark “Twilight Zone”
Phytoplankton Communities Bloom

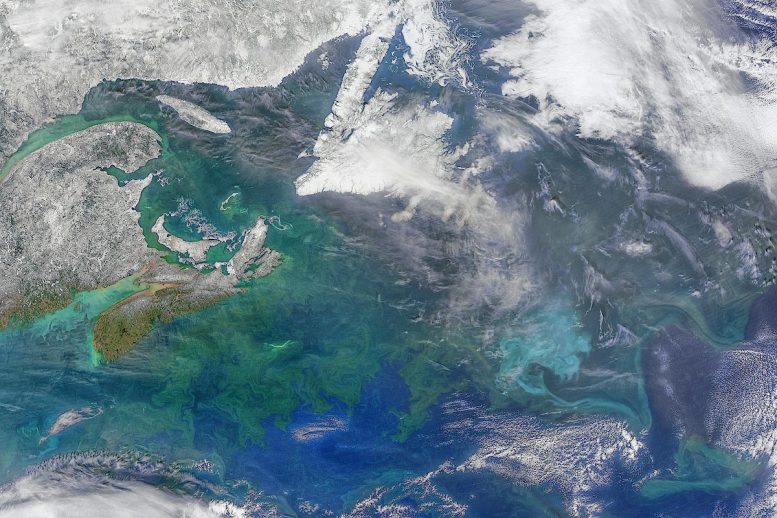
Different phytoplankton communities bloom around the Canadian Maritime Provinces and across the northwestern Atlantic Ocean. Credit: NASA/Aqua/MODIS composite collected on March 22, 2021

A seaward journey, supported by both NASA and the National Science Foundation, set sail in the northern Atlantic in early May—the sequel to a complementary expedition, co-funded by NSF, that took place in the northern Pacific in 2018.

The 2021 deployment of NASA’s oceanographic field campaign, called Export Processes in the Ocean from Remote Sensing (EXPORTS), consists of 150 scientists and crew from more than 30 governmental, university, and private non-governmental institutions. The team is spread across three oceanographic research vessels, who will meet in international waters west of Ireland over the underwater Porcupine Abyssal plain. Throughout the field campaign, scientists will be deploying a variety of instruments from aboard the three ships: the RRS James Cook and the RRS Discovery, operated by the National Oceanography Centre in Southampton, UK, plus a third vessel chartered by the Ocean Twilight Zone project of the Woods Hole Oceanographic Institution and operated by the Marine Technology Unit in Vigo, Spain. A total of 52 high-tech platforms, including several autonomous vehicles, will be taking measurements and continuously collecting data.

Diverse Plankton

Diverse plankton from surface waters seen under a microscope. It is so concentrated that you don’t need to zoom to identify. Credit: Laura Holland/ University of Rhode Island

Much of the science focuses on the ocean’s role in the global carbon cycle. Through chemical and biological processes, the ocean removes as much carbon from the atmosphere as all plant life on land. Scientists hope to further explore the mechanisms of the ocean’s biological pump—the process by which carbon from the atmosphere and surface ocean is sequestered long-term in the deep ocean. This process involves microscopic plant-like organisms called phytoplankton, which undergo photosynthesis just like plants on land and can be seen from space by observing changes to the color of the ocean. Their productivity has a significant impact on Earth’s carbon cycle, which then in turn affects Earth’s climate.

“This is the first comprehensive study of the ocean’s biological carbon pump since the Joint Global Ocean Flux study in the 1980s and nineties,” said EXPORTS science lead David Siegel from the University of California, Santa Barbara. “In the interim, we have gotten advanced microscopic imaging tools, genomics, robust chemical and optical sensors and autonomous robots—a bunch of stuff that we didn’t have back then, so we can ask much harder and much more important questions.” Those questions include how much organic carbon is leaving the surface ocean, and what path does it take as it makes its way to the deep where it can be sequestered for long periods of time, from decades to thousands of years.

RRS James Cook Deploying Sampling Rosette

Science and crew aboard the RRS James Cook are deploying a sampling rosette – platform that allows for collection of the water samples and other information from ocean depths, with RRS Discovery and R/V Sarmiento de Gamboa in the distance deploying the same instrumentation simultaneously. Credit: Deborah Steinberg

Scientists know of three major pathways that transport carbon from the atmosphere and upper ocean to the dark “twilight zone” that lies 1,640 feet (500m) or more below the surface: 1) physical ocean mixing and circulation can carry suspended organic matter deep down into the ocean’s interior, 2) particles can sink due to gravity, often after passing through the guts of organisms, and 3) daily vertical migrations of animals that commute between upper and lower ocean levels bring carbon along for the ride.

EXPORTS aims to determine how much carbon is transported by each of these pathways by observing the carbon pump in two very different ocean ecosystems with varying conditions. The researchers chose the northern Pacific and northern Atlantic because they are on the opposite ends of the productivity spectrum (i.e. rates of photosynthesis) and experience two opposing extremes of physical processes such as eddies and currents. Studying contrasting environments will provide the maximum insight for modeling future climate scenarios.

Boarding R/V Sarmiento de Gamboa

The scientist crew boarded the R/V Sarmiento de Gamboa on April 29 after 14 days in quarantine. Credit: Ken Buesseler/ Woods Hole Oceanographic Institution

According to Ivona Cetinić, project scientist and oceanographer at NASA’s Goddard Space Flight Center in Greenbelt, Maryland, the North Pacific is akin to a desert or “simple meadow” on land. It is low in nutrients, in this case iron needed for photosynthesis, and experiences amongst the fewest eddying currents found in the global oceans. Therefore, carbon transport into the deep ocean is primarily driven by tiny animals, called zooplankton, consuming microscopic plant-like phytoplankton and then excreting the digested carbon to the depths below.

Phytoplankton drift in the upper, sunlit layer of the ocean where they can convert carbon dioxide that comes from the atmosphere into organic carbon. When conditions are right, as is often the case in the North Atlantic region this time of year, phytoplankton populations grow or “bloom” so rapidly they can be seen from space.

The North Atlantic also features strong currents that contrast with the North Pacific’s slower moving waters. Along with those, Siegel says they anticipate at least four days of harsh weather during the month-long expedition.

But EXPORTS data doesn’t just apply to the sea—it will also be used to improve satellite technology. Cetinić works with several optical measurements that come from ocean color satellites, which measure light reflected from the ocean surface in parts of the visible spectrum, what we know as the colors of the rainbow. These provide insights such as measurements of the ocean’s temperature, salinity, carbon, and concentrations of a green pigment called chlorophyll. However, the varying species of phytoplankton occupying different parts of the ecosystem and carbon cycle produce different amounts and shades of green chlorophyll, creating nuance in ocean color that current ocean color satellites can’t “see.”

Among the instrumentation deployed during EXPORTS are highly refined, and in some cases experimental, optical instruments to measure ocean color that are akin to instruments which will be aboard future NASA satellites. Researchers will combine these satellite-simulating measurements with the detailed observations of the surface phytoplankton community—through genomics, image analysis or pigment composition—as well as knowledge of their physiology to enable satellites to detect oceanic diversity and ultimately their role in the oceanic carbon cycle.

The next generation of these satellites, NASA’s Plankton, Aerosol, Cloud, ocean Ecosystem (PACE) mission, will be hyperspectral, meaning it will be able to collect data across the entire visible spectrum, and capture information beyond the visible part, including ultraviolet and shortwave infrared.

“What we see while we are on the ground gives us an understanding of what kind of information we will need to see from space in order to capture those critical processes we want to be able to better understand,” Cetinić said. “That drives the development of the space-based technology. In return, data coming from the new Earth observing satellites allow for scientists, such as the ones participating in EXPORTS, to go and find other crucial information or develop new techniques to complement the current, or even inspire a new, Earth observing satellite. This perpetual interplay of technology and science, ultimately benefits the whole of humanity.”

Following the fieldwork campaign, an additional phase of EXPORTS will focus on using the data collected from the Atlantic and Pacific to predict what the carbon transport pathways may look like in future oceans.

“What we currently know is limited to what is happening in oceans today,” said Siegel. “With the ongoing climate-driven changes, seen not only in the ocean but across the Earth systems, we need to be able to predict what’s going to be happening in 2075, and we do not yet have that predictive understanding.”

Because so many characteristics of a single slice of ocean are going to be measured at the same time, existing computer models will have a rich and more complete data set depicting the carbon pump on which to base projections of what might happen in the near future deeper in the ocean—and what the impacts might be on the carbon cycle.

“It’s such a good data set that it is going to be fueling research for decades to come,” said Cetinić.

Both PACE and EXPORTS experienced delays because of the COVID-19 pandemic. Now, to ensure the safety and security of every individual involved, a two-week quarantine was required before sailing and social distancing protocols were enacted for the first week aboard the ships. Siegel says the diversity and dedication of the team members, the unparalleled support from the U.K.’s National Oceanography Centre to ensure the ships and crew are ready and safe for sailing, the sustained commitment from NASA Headquarters, and a great deal of good fortune is the reason that the campaign is still able to go ahead this year.

An Uncrackable Combination: Invisible Ink and Artificial Intelligence

Coded Message Cybersecurity Concept

Coded messages in invisible ink sound like something only found in espionage books, but in real life, they can have important security purposes. Yet, they can be cracked if their encryption is predictable. Now, researchers reporting in ACS Applied Materials & Interfaces have printed complexly encoded data with normal ink and a carbon nanoparticle-based invisible ink, requiring both UV light and a computer that has been taught the code to reveal the correct messages.

Even as electronic records advance, paper is still a common way to preserve data. Invisible ink can hide classified economic, commercial, or military information from prying eyes, but many popular inks contain toxic compounds or can be seen with predictable methods, such as light, heat, or chemicals. Carbon nanoparticles, which have low toxicity, can be essentially invisible under ambient lighting but can create vibrant images when exposed to ultraviolet (UV) light — a modern take on invisible ink.

In addition, advances in artificial intelligence (AI) models — made by networks of processing algorithms that learn how to handle complex information — can ensure that messages are only decipherable on properly trained computers. So, Weiwei Zhao, Kang Li, Jie Xu, and colleagues wanted to train an AI model to identify and decrypt symbols printed in a fluorescent carbon nanoparticle ink, revealing hidden messages when exposed to UV light.

Uncrackable Combination of Invisible Ink and Artificial Intelligence

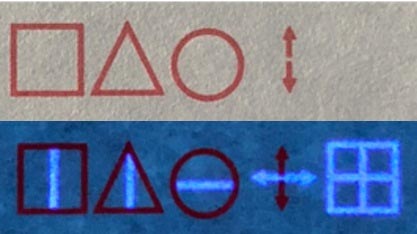
With regular ink, a computer trained with the codebook decodes “STOP” (top); when a UV light is shown on the paper, the invisible ink is exposed, and the real message is revealed as “BEGIN” (bottom). Credit: Adapted from ACS Applied Materials & Interfaces 2021, DOI: 10.1021/acsami.1c01179

The researchers made carbon nanoparticles from citric acid and cysteine, which they diluted with water to create an invisible ink that appeared blue when exposed to UV light. The team loaded the solution into an ink cartridge and printed a series of simple symbols onto paper with an inkjet printer. Then, they taught an AI model, composed of multiple algorithms, to recognize symbols illuminated by UV light and decode them using a special codebook. Finally, they tested the AI model’s ability to decode messages printed using a combination of both regular red ink and the UV fluorescent ink.

With 100% accuracy, the AI model read the regular ink symbols as “STOP,” but when a UV light was shown on the writing, the invisible ink illustrated the desired message “BEGIN.” Because these algorithms can notice minute modifications in symbols, this approach has the potential to encrypt messages securely using hundreds of different unpredictable symbols, the researchers say.

Reference: “Paper Information Recording and Security Protection Using Invisible Ink and Artificial Intelligence” by Yunhuan Yuan, Jian Shao, Mao Zhong, Haoran Wang, Chen Zhang, Jun Wei, Kang Li, Jie Xu and Weiwei Zhao, 20 April 2021, ACS Applied Materials & Interfaces.
DOI: 10.1021/acsami.1c01179

The authors acknowledge funding from the Shenzhen Peacock Team Plan and the Bureau of Industry and Information Technology of Shenzhen through the Graphene Manufacturing Innovation Center (201901161514).

RoboWig: A Robot That Can Help You Untangle Your Hair
Robot Hair Brush

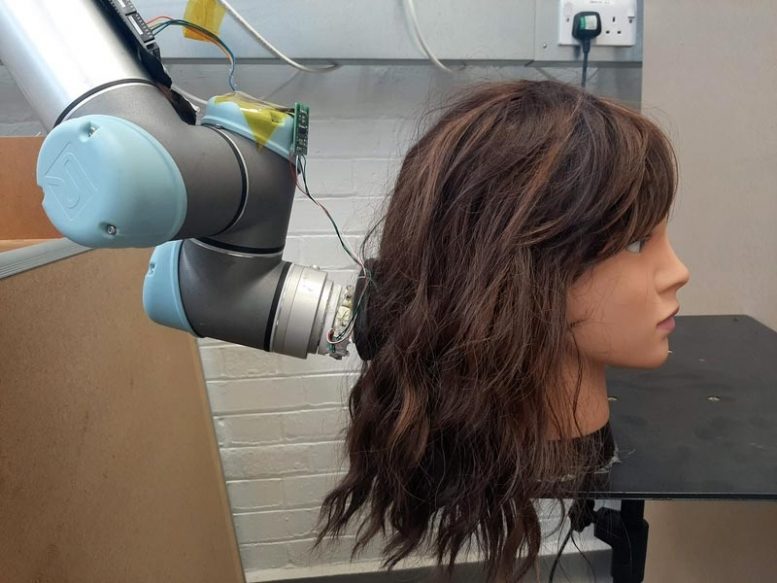
A robotic arm setup is equipped with a sensorized soft brush and aided by a camera to study the complex nature of manipulating and brushing hair fibers. Credit: Photo courtesy of MIT CSAIL

Robotic arm equipped with a hairbrush helps with brushing tasks and could be an asset in assistive-care settings.

With rapidly growing demands on health care systems, nurses typically spend 18 to 40 percent of their time performing direct patient care tasks, oftentimes for many patients and with little time to spare. Personal care robots that brush hair could provide substantial help and relief. 

This may seem like a truly radical form of “self-care,” but crafty robots for things like shaving, hair-washing, and makeup are not new. In 2011, the tech giant Panasonic developed a robot that could wash, massage, and even blow-dry hair, explicitly designed to help support “safe and comfortable living of the elderly and people with limited mobility, while reducing the burden of caregivers.” 

Hair-combing bots, however, proved to be less explored, leading scientists from MIT’s Computer Science and Artificial Intelligence Laboratory (CSAIL) and the Soft Math Lab at Harvard University to develop a robotic arm setup with a sensorized soft brush. The robot is equipped with a camera that helps it “see” and assess curliness, so it can plan a delicate and time-efficient brush-out.  

The team’s control strategy is adaptive to the degree of tangling in the fiber bunch, and they put “RoboWig” to the test by brushing wigs ranging from straight to very curly hair.

While the hardware setup of RoboWig looks futuristic and shiny, the underlying model of the hair fibers is what makes it tick. CSAIL postdoc Josie Hughes and her team opted to represent the entangled hair as sets of entwined double helices — think classic DNA strands. This level of granularity provided key insights into mathematical models and control systems for manipulating bundles of soft fibers, with a wide range of applications in the textile industry, animal care, and other fibrous systems.

“By developing a model of tangled fibers, we understand from a model-based perspective how hairs must be entangled: starting from the bottom and slowly working the way up to prevent ‘jamming’ of the fibers,” says Hughes, the lead author on a paper about RoboWig. “This is something everyone who has brushed hair has learned from experience, but is now something we can demonstrate through a model, and use to inform a robot.”

This task at hand is a tangled one. Every head of hair is different, and the intricate interplay between hairs when combing can easily lead to knots. What’s more, if the incorrect brushing strategy is used, the process can be very painful and damaging to the hair.

Previous research in the brushing domain has mostly been on the mechanical, dynamic, and visual properties of hair, as opposed to RoboWig’s refined focus on tangling and combing behavior.

To brush and manipulate the hair, the researchers added a soft-bristled sensorized brush to the robot arm, to allow forces during brushing to be measured. They combined this setup with something called a “closed-loop control system,” which takes feedback from an output and automatically performs an action without human intervention. This created “force feedback” from the brush — a control method that lets the user feel what the device is doing — so the length of the stroke could be optimized to take into account both the potential “pain,” and time taken to brush.

Initial tests preserved the human head — for now — and instead were done on a number of wigs of various hair styles and types. The model provided insight into the behaviors of the combing, related to the number of entanglements, and how those could be efficiently and effectively brushed out by choosing appropriate brushing lengths. For example, for curlier hair, the pain cost would dominate, so shorter brush lengths were optimal.

The team wants to eventually perform more realistic experiments on humans, to better understand the performance of the robot with respect to their experience of pain — a metric that is obviously highly subjective, as one person’s “two” could be another’s “eight.”

“To allow robots to extend their task-solving abilities to more complex tasks such as hair brushing, we need not only novel safe hardware, but also an understanding of the complex behavior of the soft hair and tangled fibers,” says Hughes. “In addition to hair brushing, the insights provided by our approach could be applied to brushing of fibers for textiles, or animal fibers.”

Hughes wrote the paper alongside Harvard University School of Engineering and Applied Sciences PhD students Thomas Bolton Plumb-Reyes and Nicholas Charles; Professor L. Mahadevan of Harvard’s School of Engineering and Applied Sciences, Department of Physics, and Organismic and Evolutionary Biology; and MIT professor and CSAIL Director Daniela Rus. They presented the paper virtually at the IEEE Conference on Soft Robotics (RoboSoft) earlier this month.

The project was supported, in part, by the National Science Foundation’s Emerging Frontiers in Research and Innovation program between MIT CSAIL and the Soft Math Lab at Harvard.

Forecasting a Volcano's Eruption Style Using Early Indicators of Magma Viscosity
Forecasting a Volcano’s Eruption Style Using Early Indicators of Magma Viscosity
Ahu'aila'au Lava Fountaining

Lava fountaining from the most productive eruptive fissure, called fissure 8 at the time and now named Ahu’aila’au, built a cinder cone 55 meters high, about the height of a 10-story building. Most of the 2018 lower East Rift Zone eruption’s 0.8 cubic kilometers of lava erupted from this point. Credit: B. Shiro, USGS

2018 eruption of Kīlauea Volcano in Hawai’i provided scientists with an unprecedented opportunity to identify new factors that could help forecast the hazard potential of future eruptions.

The 2018 eruption of Kīlauea Volcano in Hawai’i provided scientists with an unprecedented opportunity to identify new factors that could help forecast the hazard potential of future eruptions.

The properties of the magma inside a volcano affect how an eruption will play out. In particular, the viscosity of this molten rock is a major factor in influencing how hazardous an eruption could be for nearby communities.

Very viscous magmas are linked with more powerful explosions because they can block gas from escaping through vents, allowing pressure to build up inside the volcano’s plumbing system. On the other hand, extrusion of more viscous magma results in slower-moving lava flows.

“But magma viscosity is usually only quantified well after an eruption, not in advance,” explained Carnegie’s Diana Roman. “So, we are always trying to identify early indications of magma viscosity that could help forecast a volcano’s eruption style.”

Leilani Estates

In May 2018, eruptive fissures opened and deposited lava within the Leilani Estates subdivision on the Island of Hawaii. Over 700 homes were destroyed, displacing more than 2,000 people. Credit: B. Shiro, USGS

She led new work identifying an indicator of magma viscosity that can be measured before an eruption. This could help scientists and emergency managers understand possible patterns of future eruptions. The findings are published in Nature.

The 2018 event included the first eruptive activity in Kīlauea’s lower East Rift Zone since 1960. The first of 24 fissures opened in early May, and the eruption continued for exactly three months. This situation provided unprecedented access to information for many researchers, including Roman and her colleagues–Arianna Soldati and Don Dingwell of Ludwig-Maximilians-University of Munich, Bruce Houghton of University of Hawai’i at Mānoa, and Brian Shiro of the U.S. Geological Survey’s Hawaiian Volcano Observatory.

The event provided a wealth of simultaneous data about the behavior of both high- and low-viscosity magma, as well as about the pre-eruption stresses in the solid rock underlying Kīlauea.

Lava Channel

A fast-moving lava channel flowed from the Ahu’aila’au cone about 10 kilometers away to the ocean, where it covered about 36 square kilometers of land along the way and created 3.5-square-kilometers of new land along the coast. Where the channel slowed down in flat areas, it spread out and formed a braided pattern, seen here. Credit: B. Shiro, USGS

Tectonic and volcanic activity causes fractures, called faults, to form in the rock that makes up the Earth’s crust. When geologic stresses cause these faults to move against each other, geoscientists measure the 3-D orientation and movement of the faults using seismic instruments.

By studying what happened in Kīlauea’s lower East Rift Zone in 2018, Roman and her colleagues determined that the direction of the fault movements in the lower East Rift Zone before and during the volcanic eruption could be used to estimate the viscosity of rising magma during periods of precursory unrest.

“We were able to show that with robust monitoring we can relate pressure and stress in a volcano’s plumbing system to the underground movement of more viscous magma,” Roman explained. “This will enable monitoring experts to better anticipate the eruption behavior of volcanoes like Kīlauea and to tailor response strategies in advance.”

Reference: “Earthquakes indicated magma viscosity during Kīlauea’s 2018 eruption” by D. C. Roman, A. Soldati, D. B. Dingwell, B. F. Houghton and B. R. Shiro, 7 April 2021, Nature.
DOI: 10.1038/s41586-021-03400-x

The research was supported by an Alexander von Humboldt postdoctoral fellowship, the European Research Council Advanced Grant 834225, the U.S. National Science Foundation, and U.S. Geological Survey Disaster Supplemental Research funding.

Secret to Building Superconducting Quantum Computers With Massive Processing Power
Superconducting Quantum Bit Light-Conducting Fiber

NIST physicists measured and controlled a superconducting quantum bit (qubit) using light-conducting fiber (indicated by white arrow) instead of metal electrical cables like the 14 shown here inside a cryostat. By using fiber, researchers could potentially pack a million qubits into a quantum computer rather than just a few thousand. Credit: F. Lecocq/NIST

Optical Fiber Could Boost Power of Superconducting Quantum Computers

The secret to building superconducting quantum computers with massive processing power may be an ordinary telecommunications technology — optical fiber. 

Physicists at the National Institute of Standards and Technology (NIST) have measured and controlled a superconducting quantum bit (qubit) using light-conducting fiber instead of metal electrical wires, paving the way to packing a million qubits into a quantum computer rather than just a few thousand. The demonstration is described in the March 25 issue of Nature.

Superconducting circuits are a leading technology for making quantum computers because they are reliable and easily mass produced. But these circuits must operate at cryogenic temperatures, and schemes for wiring them to room-temperature electronics are complex and prone to overheating the qubits. A universal quantum computer, capable of solving any type of problem, is expected to need about 1 million qubits. Conventional cryostats — supercold dilution refrigerators — with metal wiring can only support thousands at the most.

Optical fiber, the backbone of telecommunications networks, has a glass or plastic core that can carry a high volume of light signals without conducting heat. But superconducting quantum computers use microwave pulses to store and process information. So the light needs to be converted precisely to microwaves. 

To solve this problem, NIST researchers combined the fiber with a few other standard components that convert, convey and measure light at the level of single particles, or photons, which could then be easily converted into microwaves. The system worked as well as metal wiring and maintained the qubit’s fragile quantum states.

“I think this advance will have high impact because it combines two totally different technologies, photonics and superconducting qubits, to solve a very important problem,” NIST physicist John Teufel said. “Optical fiber can also carry far more data in a much smaller volume than conventional cable.”

Normally, researchers generate microwave pulses at room temperature and then deliver them through coaxial metal cables to cryogenically maintained superconducting qubits. The new NIST setup used an optical fiber instead of metal to guide light signals to cryogenic photodetectors that converted signals back to microwaves and delivered them to the qubit. For experimental comparison purposes, microwaves could be routed to the qubit through either the photonic link or a regular coaxial line.

The “transmon” qubit used in the fiber experiment was a device known as a Josephson junction embedded in a three-dimensional reservoir or cavity. This junction consists of two superconducting metals separated by an insulator. Under certain conditions an electrical current can cross the junction and may oscillate back and forth. By applying a certain microwave frequency, researchers can drive the qubit between low-energy and excited states (1 or 0 in digital computing). These states are based on the number of Cooper pairs — bound pairs of electrons with opposite properties — that have “tunneled” across the junction. 

The NIST team conducted two types of experiments, using the photonic link to generate microwave pulses that either measured or controlled the quantum state of the qubit. The method is based on two relationships: The frequency at which microwaves naturally bounce back and forth in the cavity, called the resonance frequency, depends on the qubit state. And the frequency at which the qubit switches states depends on the number of photons in the cavity.

Researchers generally started the experiments with a microwave generator. To control the qubit’s quantum state, devices called electro-optic modulators converted microwaves to higher optical frequencies. These light signals streamed through optical fiber from room temperature to 4 kelvins (minus 269 C or minus 452 F) down to 20 millikelvins (thousandths of a kelvin), where they landed in high-speed semiconductor photodetectors, which converted the light signals back to microwaves that were then sent to the quantum circuit.

In these experiments, researchers sent signals to the qubit at its natural resonance frequency, to put it into the desired quantum state. The qubit oscillated between its ground and excited states when there was adequate laser power. 

To measure the qubit’s state, researchers used an infrared laser to launch light at a specific power level through the modulators, fiber and photodetectors to measure the cavity’s resonance frequency.

Researchers first started the qubit oscillating, with the laser power suppressed, and then used the photonic link to send a weak microwave pulse to the cavity. The cavity frequency accurately indicated the qubit’s state 98% of the time, the same accuracy as obtained using the regular coaxial line.

The researchers envision a quantum processor in which light in optical fibers transmits signals to and from the qubits, with each fiber having the capacity to carry thousands of signals to and from the qubit.

Reference: “Control and readout of a superconducting qubit using a photonic link” by F. Lecocq, F. Quinlan, K. Cicak, J. Aumentado, S. A. Diddams and J. D. Teufel, 24 March 2021, Nature.
DOI: 10.1038/s41586-021-03268-x

Physical Inactivity Linked to More Severe COVID-19 Infection and Higher Risk of Death

Hospital Emergency

Surpassed only by advanced age and organ transplant as a risk factor, large study shows

Physical inactivity is linked to more severe COVID-19 infection and a heightened risk of dying from the disease, finds a large US study published online in the British Journal of Sports Medicine.

Patients with COVID-19 who were consistently inactive during the 2 years preceding the pandemic were more likely to be admitted to hospital, to require intensive care, and to die than were patients who had consistently met physical activity guidelines, the findings show.

As a risk factor for severe disease, physical inactivity was surpassed only by advanced age and a history of organ transplant.

Several risk factors for severe COVID-19 infection have been identified, including advanced age, male sex, and certain underlying medical conditions, such as diabetes, obesity, and cardiovascular disease.

But physical inactivity is not one of them, even though it is a well known contributory risk factor for several long term conditions, including those associated with severe COVID-19, point out the researchers.

To explore its potential impact on the severity of the infection, including hospital admission rates, need for intensive care, and death, the researchers compared these outcomes in 48,440 adults with confirmed COVID-19 infection between January and October 2020.

The patients’ average age was 47; nearly two thirds were women (62%). Their average weight (BMI) was 31, which is classified as obese.

Around half had no underlying conditions, including diabetes, COPD, cardiovascular disease, kidney disease, and cancer; nearly 1 in 5 (18%) had only one; and almost a third (32%) had two or more.

All of them had reported their level of regular physical activity at least three times between March 2018 and March 2020 at outpatient clinics. This was classified as consistently inactive (0-10 mins/week); some activity (11-149 mins/week); or consistently meeting physical activity guidelines (150+ mins/week).

Some 7% were consistently meeting physical activity guidelines;15% were consistently inactive, with the remainder reporting some activity.

White patients were most likely to consistently meet physical activity guidelines (10%), followed by Asian patients (7%), Hispanic patients (6%) and African-American patients (5%).

Some 9% of the total were admitted to hospital; around 3% required intensive care; and 2% died. Consistently meeting physical activity guidelines was strongly associated with a reduced risk of these outcomes.

After taking account of potentially influential factors, such as race, age, and underlying medical conditions, patients with COVID-19 who were consistently physically inactive were more than twice as likely to be admitted to the hospital as those who clocked up 150+ minutes of physical activity every week.

They were also 73% more likely to require intensive care, and 2.5 times more likely to die of the infection.

And patients who were consistently inactive were also 20% more likely to be admitted to the hospital, 10% more likely to require intensive care, and 32% more likely to die of their infection than were patients who were doing some physical activity regularly.

This is an observational study, and as such, can’t establish cause. The study also relied on patients’ own assessments of their physical activity. Nor was there any measure of exercise intensity beyond the threshold of ‘moderate to strenuous exercise’ (such as a brisk walk).

But the study was large and ethnically diverse. And the researchers point out: “It is notable that being consistently inactive was a stronger risk factor for severe COVID-19 outcomes than any of the underlying medical conditions and risk factors identified by [The Centers for Disease Control] except for age and a history of organ transplant.

“In fact, physical inactivity was the strongest risk factor across all outcomes, compared with the commonly cited modifiable risk factors, including smoking, obesity, diabetes, hypertension [high blood pressure], cardiovascular disease and cancer.”

They conclude: “We recommend that public health authorities inform all populations that short of vaccination and following public health safety guidelines such as social distancing and mask use, engaging in regular [physical activity] may be the single most important action individuals can take to prevent severe COVID-19 and its complications, including death.

“This message is especially important given the increased barriers to achieving regular [physical activity] during lockdowns and other pandemic restrictions.”

Reference: “Physical inactivity is associated with a higher risk for severe COVID-19 outcomes: a study in 48 440 adult patients” by Robert Sallis, Deborah Rohm Young, Sara Y Tartof, James F Sallis, Jeevan Sall, Qiaowu Li, Gary N Smith and Deborah A Cohen, 13 April 2021, British Journal of Sports Medicine.
DOI: 10.1136/bjsports-2021-104080

Funding: Kaiser Permanente Community Benefits Funds

Female Monkeys Use Males As
Female Monkeys Use Males As “Hired Guns” for Defense Against Predators
Putty Nosed Monkey

Female putty-mosed monkey. Credit: C. Kolopp/WCS

  • Female putty-nosed monkeys use calls just to recruit males when certain predators are detected
  • Results suggest that different “dialects” exist among different populations of monkeys

Researchers with the Wildlife Conservation Society’s (WCS) Congo Program and the Nouabalé-Ndoki Foundation found that female putty-nosed monkeys (Cercopithecus nictitans) use males as “hired guns” to defend from predators such as leopards.

Publishing their results in the journal Royal Society Open Science, the team discovered that female monkeys use alarm calls to recruit males to defend them from predators. The researchers conducted the study among 19 different groups of wild putty-nosed monkeys, a type of forest guenon, in Mbeli Bai, a study area within the forests in Nouabalé-Ndoki National Park, Northern Republic of Congo.

The results promote the idea that females’ general alarm requires males to assess the nature of the threat and that it serves to recruit males to ensure group defense. Females only cease the alarm call when males produce calls associated with anti-predator defense. Results suggest that alarm-calling strategies depend on the sex of the signaler. Females recruit males, who identify themselves while approaching, for protection. Males reassure their female of their quality in predation defense, probably to assure future reproduction opportunities.

Males advertise their commitment to serve as hired guns by emitting general “pyow” calls while approaching the rest of their group – a call containing little information about ongoing events, but cues to male identity, similar as to a signature call. Hearing his “pyow” call during male approaches enables females to identify high quality group defenders already from a distance. This might contribute to long-term male reputation in groups, which would equip females to choose males that ensure their offspring’s survival most reliably.

Said the study’s lead author Frederic Gnepa Mehon of WCS’s Congo Program and the Nouabalé-Ndoki Foundation: “Our observations on other forest guenons suggest that if males do not prove to be good group protectors, they likely have to leave groups earlier than good defenders. To date, it remains unclear whether female guenons have a saying in mate choice, but our current results strongly suggest this possibility.”

In the course of this study, a new call type was consistently recorded named “kek.” They found that the males used the “kek” call when exposed to a moving leopard model created by researchers for field experiments. Previous studies of putty-nosed monkeys in Nigeria never reported “keks.” This new type of call could thus be population-specific or it could be uttered towards moving threats. If “kek” calls are population specific, this could suggest that different “dialects” exist amongst putty-nosed monkeys – a strong indicator for vocal production learning, which is fiercely debated to exist in the animal kingdom.

Said co-author Claudia Stephan Wildlife Conservation Society’s (WCS) Congo Program and the Nouabalé-Ndoki Foundation: “Sexual selection might play a far more important role in the evolution of communication systems than previously thought. In a phylogenetic context, what strategies ultimately drove the evolution of communication in females and in males? Might there even be any parallels to female and male monkeys’ different communication strategies in human language?”

The authors say that current results considerably advanced the understanding of different female and male alarm calling both in terms of sexual dimorphisms in call production and call usage. Interestingly, although males have more complex vocal repertoires than females, the cognitive skills that are necessary to strategically use simple female repertoires seem to be more complex than those necessary to follow male calling strategies. In other words, female putty-nosed monkeys’ alarms may contain little information, but they do so by purpose, namely to facilitate the manipulation of male behavior.

Reference: “Female putty-nosed monkeys (Cercopithecus nictitans) vocally recruit males for predator defence” by Frederic Gnepa Mehon and Claudia Stephan, 17 March 2021, Royal Society Open Science.
DOI: 10.1098/rsos.202135

MIT's Comprehensive Map of the SARS-CoV-2 Genome and Analysis of Nearly 2,000 COVID Mutations
MIT’s Comprehensive Map of the SARS-CoV-2 Genome and Analysis of Nearly 2,000 COVID Mutations
Comprehensive Map of the SARS-CoV-2 Genome

MIT researchers generated what they describe as the most complete gene annotation of the SARS-CoV-2 genome. Credit: MIT News

MIT researchers have determined the virus’ protein-coding gene set and analyzed new mutations’ likelihood of helping the virus adapt.

In early 2020, a few months after the Covid-19 pandemic began, scientists were able to sequence the full genome of SARS-CoV-2, the virus that causes the Covid-19 infection. While many of its genes were already known at that point, the full complement of protein-coding genes was unresolved.

Now, after performing an extensive comparative genomics study, MIT researchers have generated what they describe as the most accurate and complete gene annotation of the SARS-CoV-2 genome. In their study, which was published on May 11, 2021, in Nature Communications, they confirmed several protein-coding genes and found that a few others that had been suggested as genes do not code for any proteins.

“We were able to use this powerful comparative genomics approach for evolutionary signatures to discover the true functional protein-coding content of this enormously important genome,” says Manolis Kellis, who is the senior author of the study and a professor of computer science in MIT’s Computer Science and Artificial Intelligence Laboratory (CSAIL) as well as a member of the Broad Institute of MIT and Harvard.

The research team also analyzed nearly 2,000 mutations that have arisen in different SARS-CoV-2 isolates since it began infecting humans, allowing them to rate how important those mutations may be in changing the virus’ ability to evade the immune system or become more infectious.

Comparative genomics

The SARS-CoV-2 genome consists of nearly 30,000 RNA bases. Scientists have identified several regions known to encode protein-coding genes, based on their similarity to protein-coding genes found in related viruses. A few other regions were suspected to encode proteins, but they had not been definitively classified as protein-coding genes.

To nail down which parts of the SARS-CoV-2 genome actually contain genes, the researchers performed a type of study known as comparative genomics, in which they compare the genomes of similar viruses. The SARS-CoV-2 virus belongs to a subgenus of viruses called Sarbecovirus, most of which infect bats. The researchers performed their analysis on SARS-CoV-2, SARS-CoV (which caused the 2003 SARS outbreak), and 42 strains of bat sarbecoviruses.

Kellis has previously developed computational techniques for doing this type of analysis, which his team has also used to compare the human genome with genomes of other mammals. The techniques are based on analyzing whether certain DNA or RNA bases are conserved between species, and comparing their patterns of evolution over time.

Using these techniques, the researchers confirmed six protein-coding genes in the SARS-CoV-2 genome in addition to the five that are well established in all coronaviruses. They also determined that the region that encodes a gene called ORF3a also encodes an additional gene, which they name ORF3c. The gene has RNA bases that overlap with ORF3a but occur in a different reading frame. This gene-within-a-gene is rare in large genomes, but common in many viruses, whose genomes are under selective pressure to stay compact. The role for this new gene, as well as several other SARS-CoV-2 genes, is not known yet.

The researchers also showed that five other regions that had been proposed as possible genes do not encode functional proteins, and they also ruled out the possibility that there are any more conserved protein-coding genes yet to be discovered.

“We analyzed the entire genome and are very confident that there are no other conserved protein-coding genes,” says Irwin Jungreis, lead author of the study and a CSAIL research scientist. “Experimental studies are needed to figure out the functions of the uncharacterized genes, and by determining which ones are real, we allow other researchers to focus their attention on those genes rather than spend their time on something that doesn’t even get translated into protein.”

The researchers also recognized that many previous papers used not only incorrect gene sets, but sometimes also conflicting gene names. To remedy the situation, they brought together the SARS-CoV-2 community and presented a set of recommendations for naming SARS-CoV-2 genes, in a separate paper published a few weeks ago in Virology.

Fast evolution

In the new study, the researchers also analyzed more than 1,800 mutations that have arisen in SARS-CoV-2 since it was first identified. For each gene, they compared how rapidly that particular gene has evolved in the past with how much it has evolved since the current pandemic began.

They found that in most cases, genes that evolved rapidly for long periods of time before the current pandemic have continued to do so, and those that tended to evolve slowly have maintained that trend. However, the researchers also identified exceptions to these patterns, which may shed light on how the virus has evolved as it has adapted to its new human host, Kellis says.

In one example, the researchers identified a region of the nucleocapsid protein, which surrounds the viral genetic material, that had many more mutations than expected from its historical evolution patterns. This protein region is also classified as a target of human B cells. Therefore, mutations in that region may help the virus evade the human immune system, Kellis says.

“The most accelerated region in the entire genome of SARS-CoV-2 is sitting smack in the middle of this nucleocapsid protein,” he says. “We speculate that those variants that don’t mutate that region get recognized by the human immune system and eliminated, whereas those variants that randomly accumulate mutations in that region are in fact better able to evade the human immune system and remain in circulation.”

The researchers also analyzed mutations that have arisen in variants of concern, such as the B.1.1.7 strain from England, the P.1 strain from Brazil, and the B.1.351 strain from South Africa. Many of the mutations that make those variants more dangerous are found in the spike protein, and help the virus spread faster and avoid the immune system. However, each of those variants carries other mutations as well.

“Each of those variants has more than 20 other mutations, and it’s important to know which of those are likely to be doing something and which aren’t,” Jungreis says. “So, we used our comparative genomics evidence to get a first-pass guess at which of these are likely to be important based on which ones were in conserved positions.”

This data could help other scientists focus their attention on the mutations that appear most likely to have significant effects on the virus’ infectivity, the researchers say. They have made the annotated gene set and their mutation classifications available in the University of California at Santa Cruz Genome Browser for other researchers who wish to use it.

“We can now go and actually study the evolutionary context of these variants and understand how the current pandemic fits in that larger history,” Kellis says. “For strains that have many mutations, we can see which of these mutations are likely to be host-specific adaptations, and which mutations are perhaps nothing to write home about.”

Reference: “SARS-CoV-2 gene content and COVID-19 mutation impact by comparing 44 Sarbecovirus genomes” by Irwin Jungreis, Rachel Sealfon and Manolis Kellis, 11 May 2021, Nature Communications.
DOI: 10.1038/s41467-021-22905-7

The research was funded by the National Human Genome Research Institute and the National Institutes of Health. Rachel Sealfon, a research scientist at the Flatiron Institute Center for Computational Biology, is also an author of the paper.